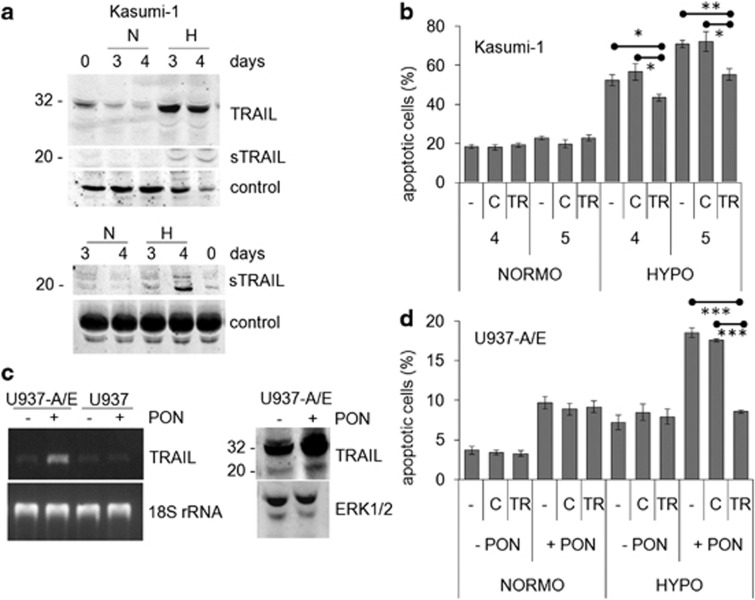
Figure 3.
Effects of AML1/ETO and hypoxia on TRAIL expression and apoptosis. (a) Kasumi-1 cells were cultured for the indicated times in normoxia (N) or hypoxia (H) and cell lysates (top) or culture supernatants (bottom) were subjected to SDS-PAGE and immunoblotting with the anti-TRAIL antibody; sTRAIL: soluble form of TRAIL. Equalization of protein loading was verified on the same membrane (control). Representative results from one out of three independent experiments are shown. (b) Kasumi-1 cells were incubated in normoxia (NORMO) or hypoxia (HYPO) for the indicated times (days) in the absence (–) or the presence of a blocking anti-TRAIL antibody (TR) or of control rabbit IgG (c), and then the percentages of apoptotic cells were measured by Annexin V test and flow cytometry and reported as average±S.E.M. of data from three independent experiments. (c) (Left) U937-A/E or U937 cells were incubated for 2 days (from day −2 to time 0) in normoxia, in the absence (–) or the presence (+) of 5 μM ponasterone (PON) added daily, and then cells were lysed and total RNA extracted. RT-PCR for TRAIL or 18S rRNA was then performed. Representative results from one out of three independent experiments are shown. (Right) U937-A/E cells treated as above were incubated for further 2 days in hypoxia. Cell lysates were subjected to SDS-PAGE and immunoblotting with the indicated antibodies. (d) U937-A/E cells were incubated for 2 days (from day −2 to time 0) in normoxia, in the absence (–PON) or the presence (+PON) of 5 μM ponasterone added daily, and then incubated and treated for 2 days as described for (b). Data, reported as described for (b), are from three independent experiments. (b, d) Significance of differences was determined by the Student's t-test for paired samples (*P<0.05; **P<0.01; ***P<0.005)

