Figure 5.
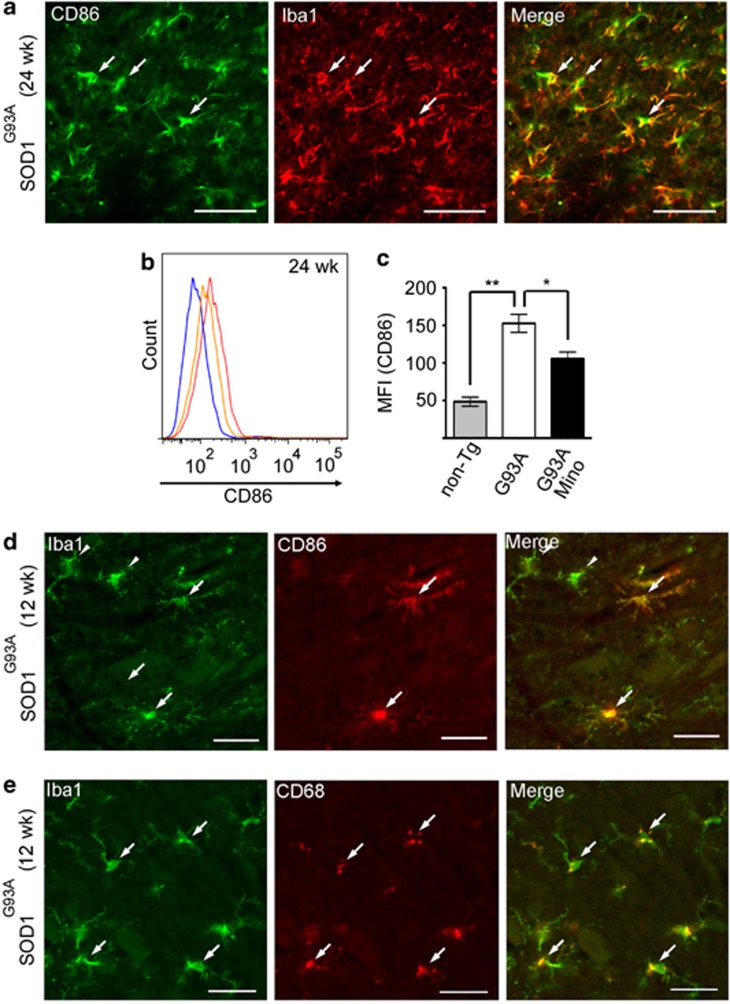
CD86 and CD68 were expressed in a subpopulation of microglia. (a) The SOD1G93A mouse lumbar spinal cords at 24 weeks were stained with anti-CD86 (M1 marker) and anti-Iba1 (microglia marker). Bars, 50 μm. Arrows indicate the co-localized cells. (b) A representative profile of CD86 expression in CD11b-positive cells at 24 weeks. Blue line: non-Tg mice; red line: SOD1G93A mice; orange line: minocycline-treated SOD1G93A mice. (c) Quantitative data of MFI of CD86 (n=3). Error bars, S.E. **P<0.01, *P<0.05. (d and e) The SOD1G93A mouse lumbar spinal cords at 12 weeks were stained with anti-CD86 or anti-CD68 and anti-Iba1. Bars, 50 μm. Arrows indicate the co-localized cells, and arrow heads indicate the Iba1 single positive cells

