Figure 5.
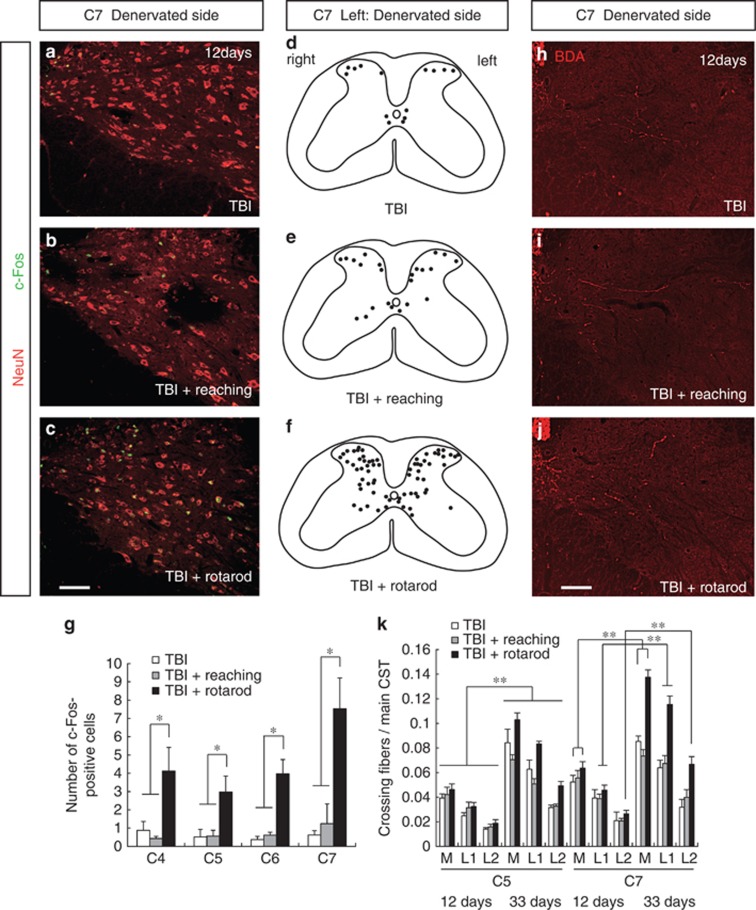
Changes in c-Fos expression and crossing CST fibers in cervical cord after rehabilitative training. (a–c) Representative images of NeuN (red) and c-Fos (green) double staining at C7 of the denervated side (day 12 after TBI). (a) TBI; (b) TBI+reaching; and (c) TBI+rotarod. Scale bar: 100 μm. (d and e) Plots showing c-Fos-positive cells localization. (d) TBI; (e) TBI+reaching; and (f) TBI+rotarod. (g) The number of c-Fos-positive cells in the denervated side of C4–C7 (lamina VII, VIII, and X). (h–j) Representative images of BDA-labeled CST fibers at C7 of the denervted cervical cord in TBI, n=5 (h), TBI+reaching, n=6 (i), and TBI+rotarod, n=5 (j) groups (day 12 after TBI). (k) The number of crossing fibers in each compartment (M, M–L1; L1, L1–L2; and L2, lateral to L2) of the denervated side in C5 and C7 at days 12 and 33 after the injury. Two-way ANOVA followed by Tukey–Kramer test, *P<0.05, **P<0.01

