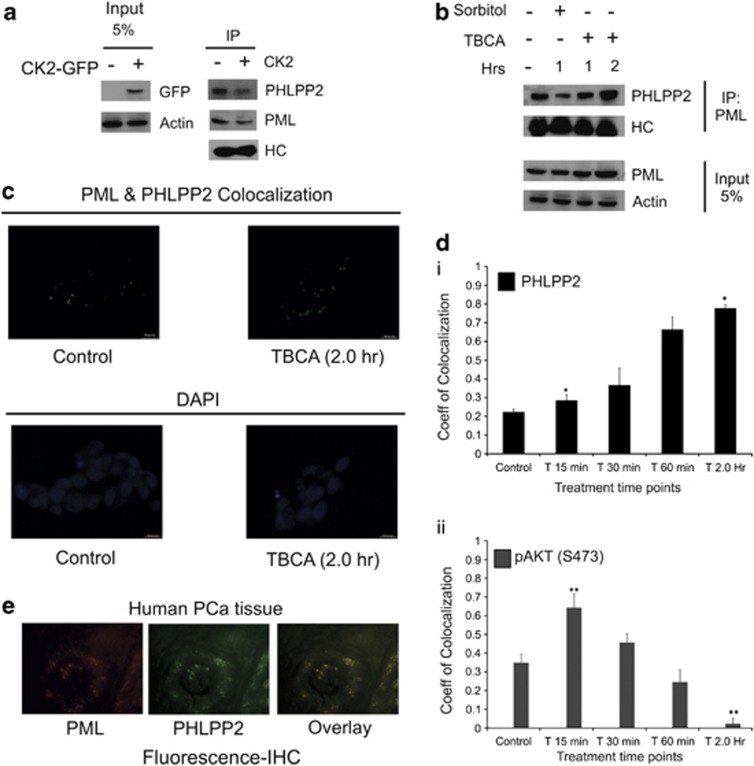
Figure 3.
Tumor suppressor PML interacts with phosphatase PHLPP2 in the nucleus. (a) Interaction between PML and PHLPP2 in PC3 cells decreases with CK2 overexpression. PC3 cells were transfected with WT-CK2α. Lysates were subjected to IP with anti-PML antibody (*PG-M3; mouse monoclonal) followed by IB with PHLPP2 antibodies. (b) Interaction of PHLPP2 with PML varies with PML level in the cell. PC3 cells were treated with either d—Sorbitol or TBCA for the indicated time points. IP was performed from the lysates, with anti-PML antibody followed by IB with PHLPP2 antibody. Control cells were treated with DMSO-water. (c) Endogenous co-localization of PHLPP2 and PML increases with CK2 inhibition/PML stabilization. (d) (i–ii) Quantitative depiction of correlation coefficient through time-lapse co-localization with increasing duration of TBCA treatment. PC3 cells were treated with TBCA and processed for in vitro time-lapse co-localization by simultaneously probing with either anti-PML and anti-PHLPP2 antibody or anti-PML and anti-pAKT(S473) antibody in combinations. Pearson's Coefficient of co-localization was determined at the indicated time points and quantitatively plotted. The level of significance (*P=0.022 and **P=0.017), respectively. (e) Representative figure depicting co-localization of PML and PHLPP2 in PCa tissues. In every case, bars represent (±) S.D. of three independent biological repeats at the mentioned level of significances

