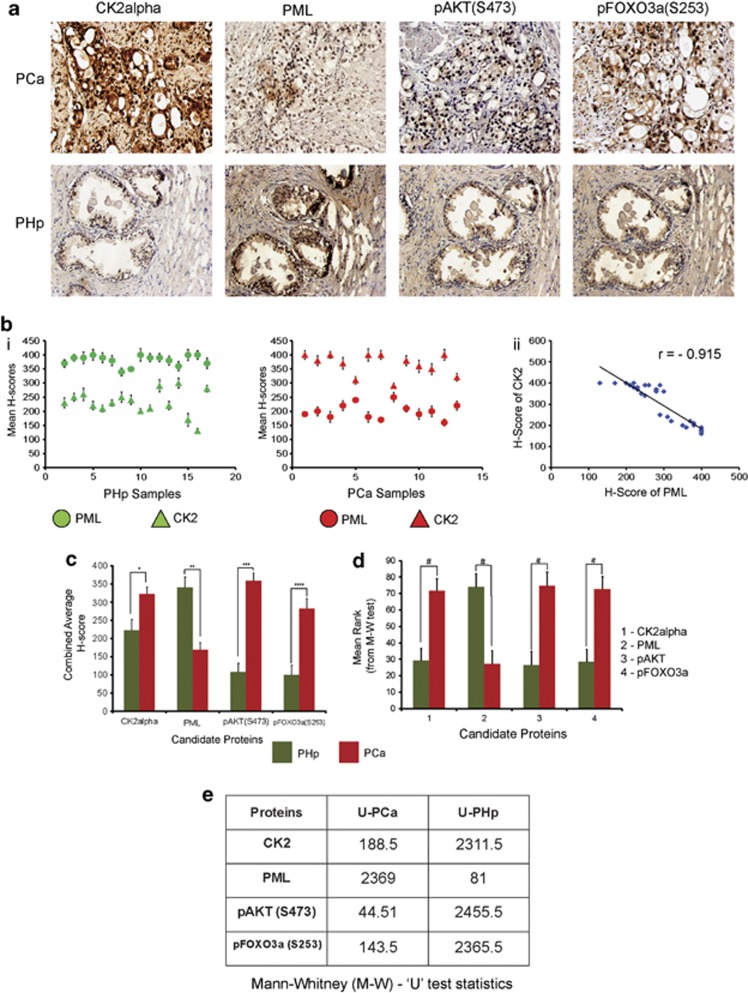
Figure 7.
Protein kinase CK2 is upregulated in PCa while PML has a low expression, rest of the members in the postulated signaling axis manifests a congruent picture. (a) Representative IHC images of the candidate proteins involved in the signaling axis, viz.; CK2 (CK2α), PML, pAKT(S473) and pFOXO3a(S253) in PCa and PHp tissue samples. (b) (i) Scattered plot, representing the mean H-scores of respective PCa and PHp tissue samples, (ii) Depiction of correlation coefficient (r) between mean H-scores of CK2 and PML estimated from IHC images of both PCa and PHp tissues combined. (c) Comparison of combined average H-scores of CK2α, PML, pAKT(S473) and pFOXO3a(S253). The bars represent the mean (±) S.D. of independent two-tailed Student's t-tests, where *P=0.027, **P=0.004, ***P=0.039 and ****P=0.016 are the respective level of significances. The quantitative depictions of Mann–Whitney U-test (M–W U-test). (d) Graphical representation of mean ranks of the observed individual H-scores of each candidate proteins as obtained through calculations from M–W U- test. The observed #P-value is <0.001. (e) Table displaying the calculated ‘U' values for the H-scores of each observed proteins

