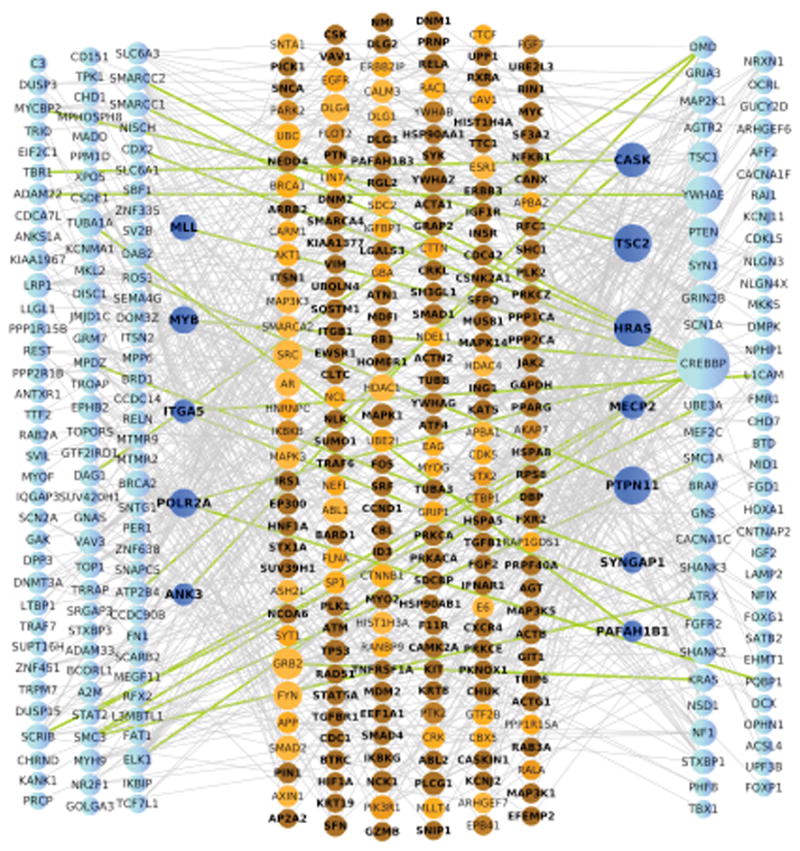
Figure 2. Direct and indirect Protein-Protein interaction for genes with a functional de novo event and existing ASD/ID genes.

PPI network analysis for de novo variants and prior ASD genes (ASD112). Nodes are sized based on connectivity. Genes harboring de novo variants (left) and prior ASD genes (right) are colored blue with dark blue nodes represent genes that belong to one of these lists and are also intermediate proteins. Intermediate proteins (center) are colored in shades of orange based on a p-value computed using a proportion test where darker color represents a lower p-value. Green edges represent direct connections between genes harboring de novo variants (left) and prior ASD genes. All other edges, connecting to intermediate proteins are shown in grey.
