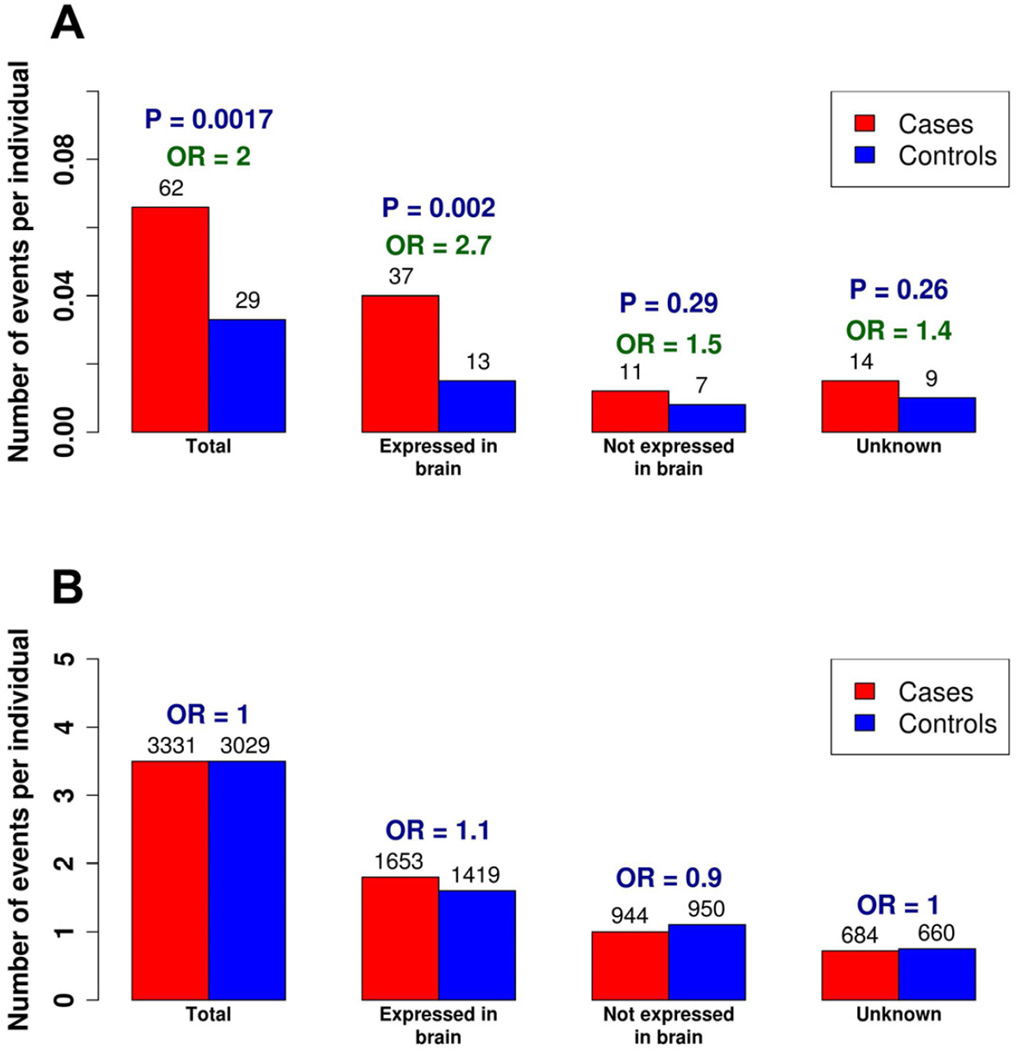
Figure 1. Expression Patterns of the Complete Knockouts.
(A) The enrichment of rare complete knockouts in cases versus controls.
(B) The enrichment observed in rare complete knockouts is not observed in the common complete knockouts.
The x-axis indicates the average number of events per individual in cases and controls and the numbers above the barplots indicate the total number of such events in cases and controls, with the odds ratios (OR) shown above.

