
Figure 2.
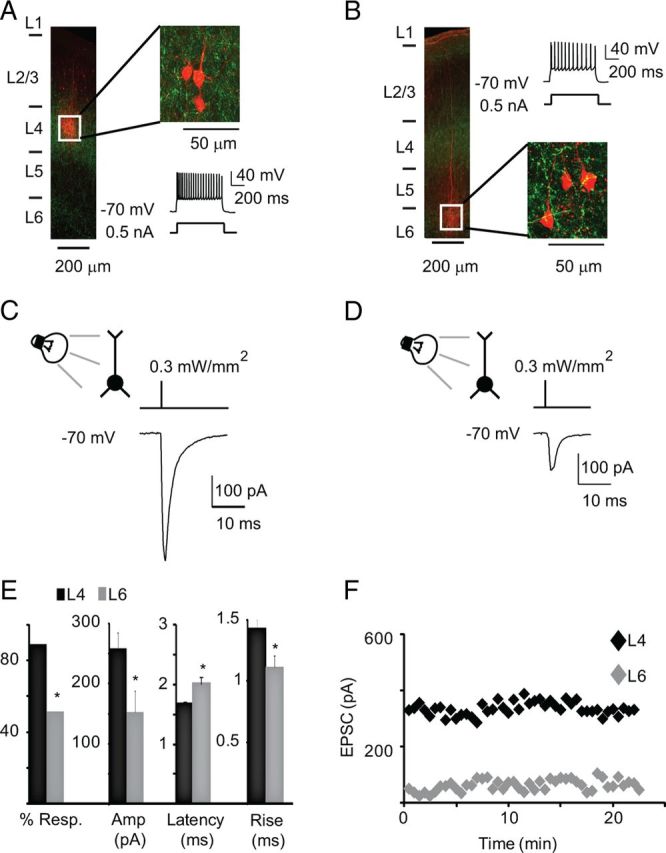
Pyramidal neurons in L4 and upper L6 respond to light activation of TC afferents. A, Post hoc reconstruction of recording configuration in L4. Left, Image of a coronal slice in which a triplet of star pyramidal neurons was recorded in L4. White square, Region in which neurons were recorded. Green, ChR2-GFP; red, biocytin-Alexa Fluor 594. Top right, Enlargement of the region indicated by the white square. Bottom right, Firing pattern of recorded neurons in response to a 0.5 nA current pulse. The firing pattern is typical of L4 star pyramids. B, Representative image of post hoc reconstruction of L6 recordings. Left, Image of coronal slice, with neurons recorded in L6 (see white square). Green, ChR2-GFP; red, biocytin-Alexa Fluor 594. Top right, Firing pattern of L6 neurons in response to a 0.5 nA current pulse. Firing pattern is typical of L6 pyramidal neurons. Bottom right, Enlargement of region indicated by the white square. C, Brief light pulses (1 ms/0.3 mW/mm2) evoke TC-EPSCs in L4 star pyramids. Top, Recording configuration and diagram of light stimulus. Bottom, TC-EPSC evoked from one of the neurons shown in A. D, Brief light pulses (1 ms/0.3 mW/mm2) elicit synaptic response in L6 pyramidal neurons. Top, Recording configuration and diagram of light stimulus. Bottom, Light-evoked response evoked in one of the neurons shown in B. E, Bar plot of the percentage of neurons responding to light pulses (% Resp.), of average TC-EPSC amplitude at 0.3 mW/mm2, of latency of the TC-EPSC onset from stimulus onset (Latency), and of the rise time of the light-evoked TC-EPSC (Decay) in L4 (black) and L6 (gray). F, Time course of the light-evoked responses for the neurons shown in C (L4; black) and D (L6; gray). Light intensity, 0.3 mW/mm2. Data are represented as mean ± SE; asterisks indicate significant differences.