Figure 6.
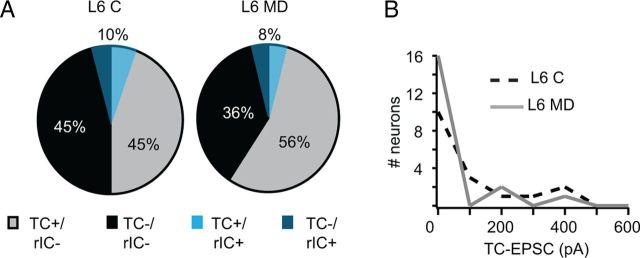
MD does not affect the organization of TC/rIC inputs onto L6 pyramidal neurons. A, Pie charts of the proportion of L6 pyramidal neurons not responding to light activation of TC afferents and not recurrently connected (black, TC−/rIC−), of L6 pyramidal neurons not responding to light activation of TC afferents but recurrently connected (dark blue, TC−/rIC+), of L6 pyramidal neurons responding to light activation of TC afferents and not recurrently connected (gray, TC+/rIC−), and of L6 pyramidal neurons responding to light activation of TC afferents and recurrently connected (light blue, TC+/rIC+). Left chart, Control hemisphere (C); right chart, deprived hemisphere (MD). B, Distribution of TC-EPSC amplitudes for L6 TC+/rIC− pyramidal neurons. Light intensity: 0.3 mW/mm2. Control, Black dotted line; deprived, gray solid line.

