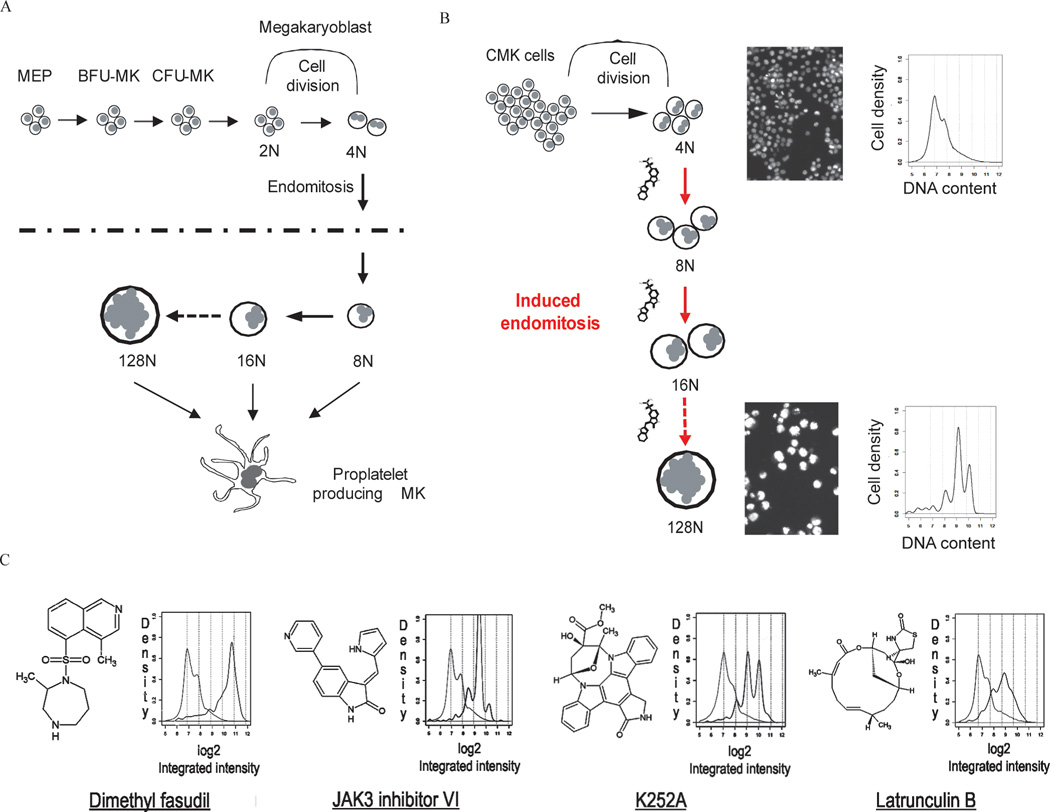
Figure 1. Cell-based, high-content imaging screen for compounds that induce megakaryocyte polyploidization.
(A) Schematic of megakaryocyte development. MEP, megakaryocyte-erythroid progenitor; BFU-MK, burst-forming unit-megakaryocyte; CFU-MK, colony-forming unit megakaryocyte. (B) Schematic of the image-based high-throughput screen to identify small molecules that induce polyploidization of leukemic megakaryocytes. (C) Structures of representative hit compounds and their effects on megakaryocyte polyploidization. Structures (left) and histograms of DNA content as measured by CellProfiler (right) are shown. Light gray lines depict DMSO control and black lines depict ploidy states of cells cultured with the respective compounds.

