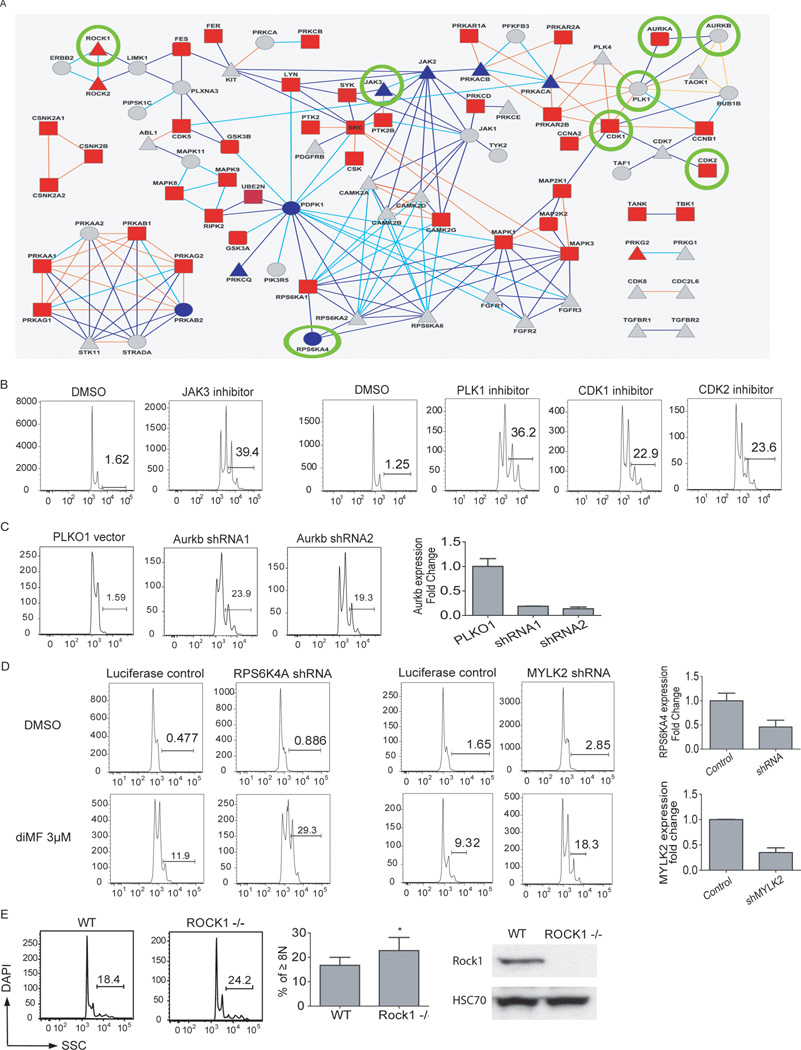
Fig 7. Pathways that regulate polyploidization of megakaryocytes.
(A). Reactome analysis integrating the data from the KinomeScan, SILAC, and RNAi screen yielded 117 proteins that were mapped to 116 nodes and 194 connections. In the protein network, shapes of nodes correspond to the source; squares for SILAC, circles for RNAi, rounded squares for both SILAC and RNAi, triangles for Kinome scan only. Colors of the nodes correspond to false-discovery rate of SILAC ratio in the range 0.05 (red) – 1.0 (blue) or gray for proteins not detected by SILAC. Colors of connections correspond to the type of interaction: direct complex (orange), indirect complex (yellow), reaction (blue), neighboring reaction (cyan). Thick connections mark pairs of proteins not distinguished from each other by SILAC. Kinases that were validated in separate experiments are circled. (B–E). Validation of kinases in the network. (B) Induction of CMK polyploidization after 72 hours of treatment with JAK3 inhibitor VI (1 µM), PLK1 inhibitor (1 µM), CDK1 inhibitor (3 µM) and CDK2 inhibitor (3 µM) is shown. (C) Knockdown of Aurkb induced polyploidization of megakaryocytes. 6133/MPL cells were transduced with PLKO1 control vector or shRNA against Aurkb. (D) Knockdown of RPS6KA4 or MYLK2 sensitized CMK cells to diMF treatment. CMK cells transduced with luciferase control viruses or shRNAs against RPS6KA4 or MYLK2 were cultured with DMSO or diMF (3 µM) for 72 hr. The extent of gene knockdown as assessed by qRT-PCR is shown. Results are representative of two independent experiments performed in duplicate. (E) (Left) Megakaryocytes (CD41+) derived from the bone marrow of Rock1-null mice showed increased degree of polyploidization relative to megakaryocytes from their wild-type littermates. (Middle) Bar graphs depict the percentages of cells with DNA contents ≥8N. Error bars represent mean ± SD; * p<0.05, n=5 mice per group. (Right) Expression of ROCK1 was assessed by western blot in extracts from murine bone marrow mononuclear cells.

