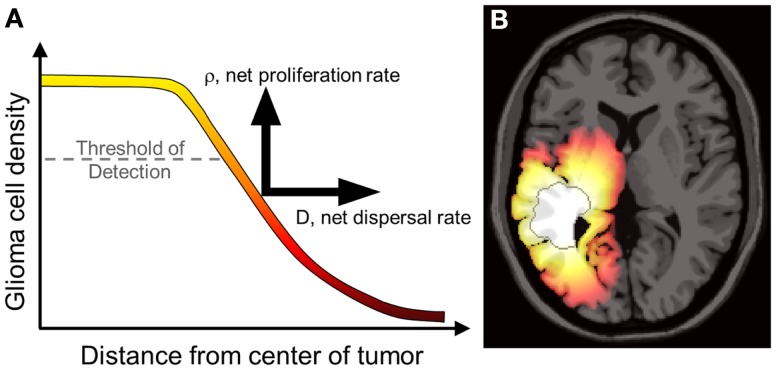
Figure 1.
(A) Concentrations of tumor cells contributing to a gradient of diffusely invading glioma cells extending well beyond the threshold of detection. The PI model characterizes the net rates of growth and invasion of the glioma cells contributing to this overall profile, a sum of individual cell behaviors. Swanson et al. have demonstrated that D and ρ can be calculated on a patient-specific basis and can vary widely, even for patients within the same histological grade (Harpold et al., 2007; Swanson et al., 2008a; Szeto et al., 2009b; Wang et al., 2009; Rockne et al., 2010). (B) A simulation of the reaction-diffusion mathematical model on an anatomically accurate brain phantom (Cocosco et al., 2004) with differential motility in gray and white matter as proposed by Swanson (1999). The MRI-detectable edge of the lesion is superimposed as a dark gray contour emphasizing the extent of invasion well beyond the threshold of detection. From Wang et al. (2009) with permission from Cancer Research.

