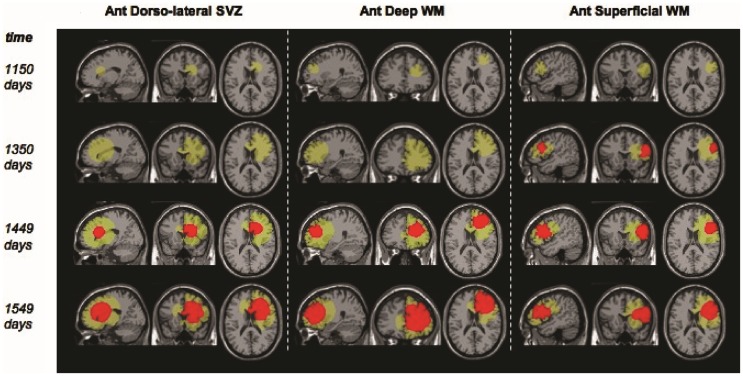
Figure 4.
“Example screenshots from glioma growth model simulations with varied points of origin. Images at four time points each for three simulated lesions provided in the sagittal, coronal, and axial planes for lesion start points at the anterior dorsolateral subventricular zone, anterior deep white matter, and anterior superficial white matter. Green area reflects estimated T2-weighted image abnormality on magnetic resonance; red area reflects estimated T1-weighted image post-gadolinium abnormality.” Courtesy: Bohman et al. (2010).

