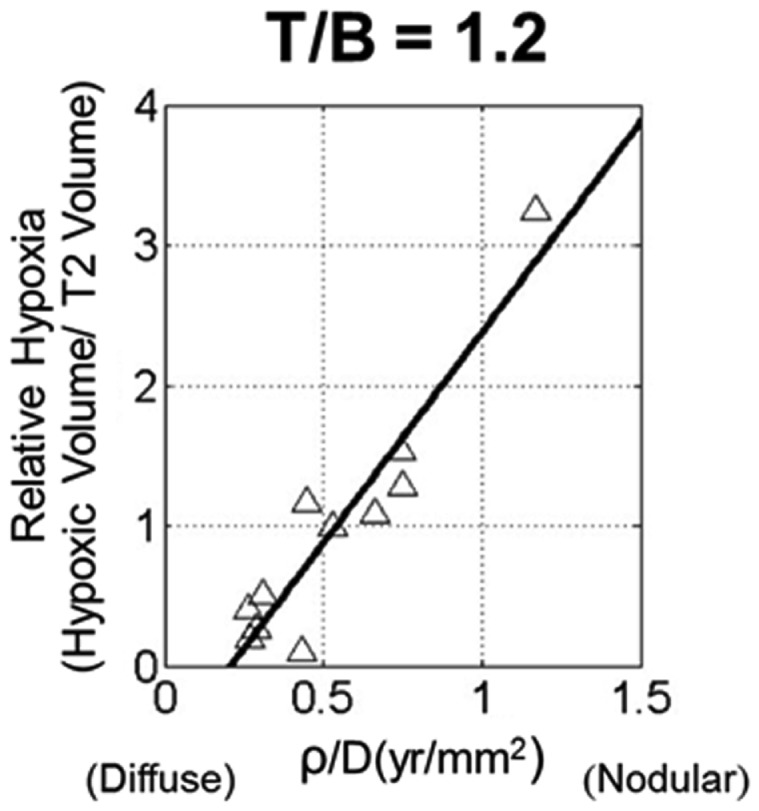
Figure 5.

Scatter plot of relative hypoxia (RH, the ratio of hypoxic volume to T2-weighted MRI volume) versus ρ/D for n = 11 glioblastoma patients. RH was determined over a variety of tissue to blood (T/B) tracer levels, ranging from 1.1 to 1.6 in increments of 0.1. A strong linear relationship between the variables is shown for all thresholds; correlations were statistically significant for all T/B levels considered. From Szeto et al. (2009b), with permission from Nature Publishing Group, Cancer Research.
