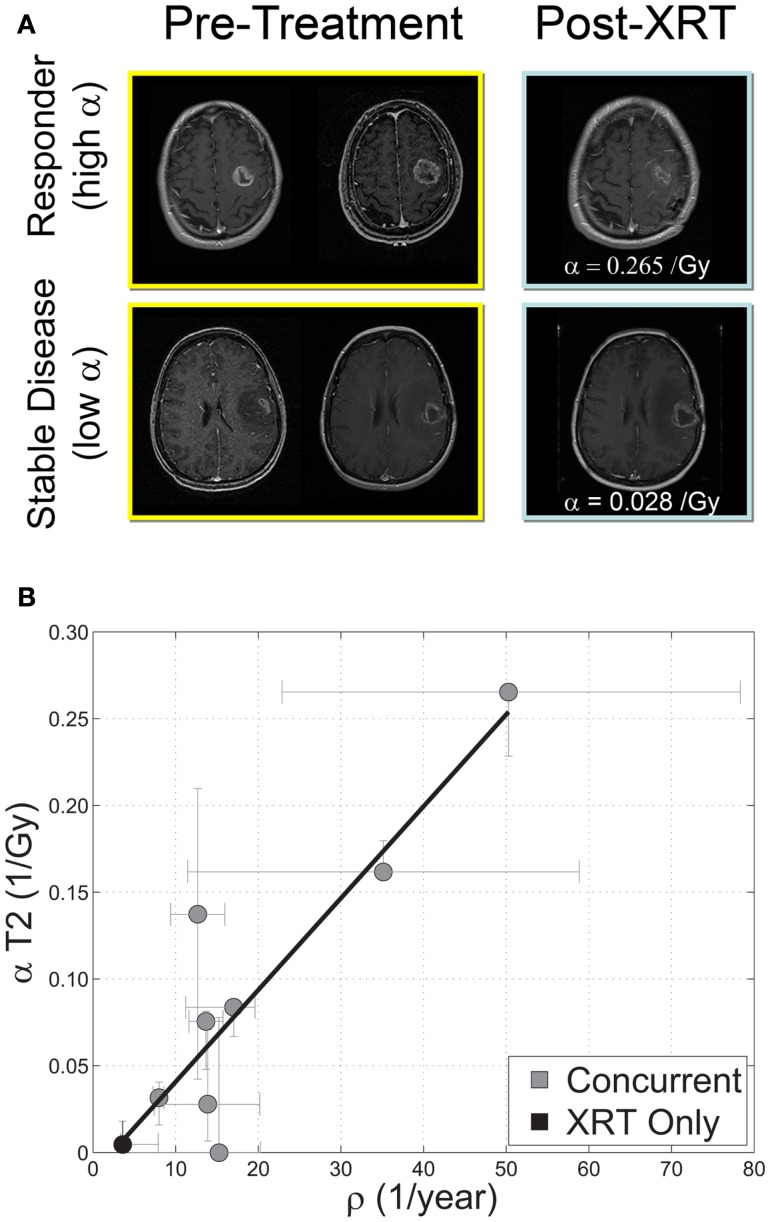
Figure 9.
(A) “Response to therapy is conventionally assessed by determining changes in gross tumor volume (GTV) on MRI prior to and after the administration of therapy. Post-contrast T1-weighted MRI images are shown for two glioblastoma patients that would typically be separated into generic groups: responder and stable disease. The radiation response parameter α gives an additional quantification of radiation response for each patient.” (B) “Relationship between radiation response and tumor proliferation rate parameters α (Gy−1) and ρ (1/year), respectively, with α calculated relative to changes in T2 GTV post therapy r = 0.89, ρ ≪ 0.05, N = 9. Error bars on ρ are calculated by propagation of error in pre-treatment GTV as assessed by inter-observer variability of ±1 mm in equivalent spherical radius. Error bars in α are computed by taking the maximum and minimum values of α in a leave one out cross validation (LOOCV) technique.” Courtesy: Rockne et al. (2010), with permission from IOP Publishing Ltd.

