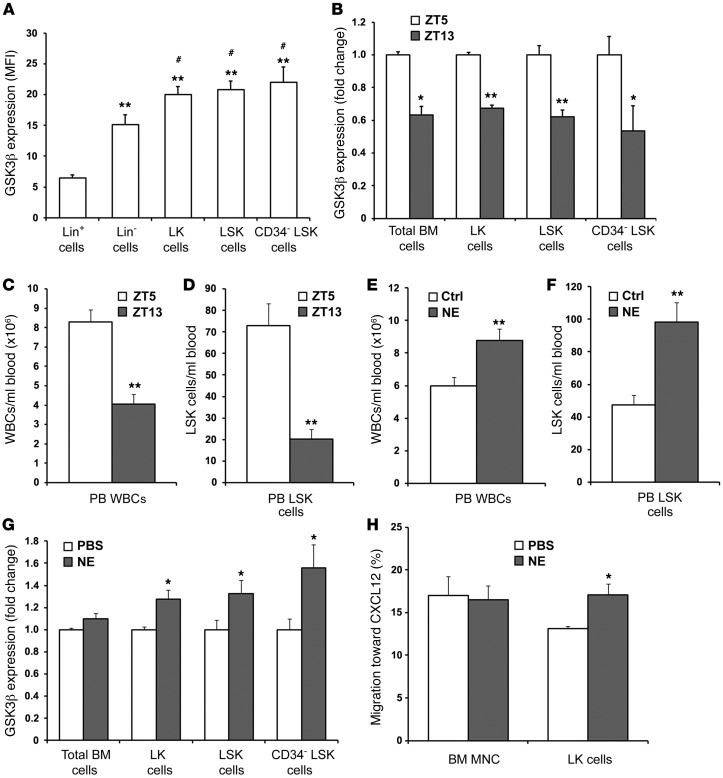
Figure 1. GSK3β expression in HSPCs correlates with their physiological egress rates and is regulated by adrenergic signals.
(A) GSK3β expression levels in MFI units were compared between mature and immature BM populations: Lin+ cells, Lin– cells, Lin–cKit+ (LK) cells, Lin–Sca-1+cKit+ (LSK) cells, and CD34–Lin–Sca-1+cKit+ (CD34–LSK, i.e., phenotypic HSCs) (n = 4–6). **P < 0.01 compared with Lin+ cells, and #P < 0.05 compared with Lin– cells. (B–D) Mice were sacrificed at ZT5 (5 hours after initiation of light) and ZT13 (1 hour after initiation of darkness). (B) GSK3β expression (fold change) was determined by flow cytometry in total BM cells, LK cells, LSK cells, and CD34–LSK cells at ZT5 and ZT13 (n = 3–5). PB was obtained to measure circulating WBCs (C) and LSK cells, indicating HSPCs (D) (n = 6). (E–H) Mice were treated with 10 mg/kg NE or PBS and sacrificed after 1 hour. PB was then obtained to measure circulating WBCs (E) and LSK cells (F) (n = 5–8). (G) GSK3β expression was determined by flow cytometry in total BM cells, LK cells, LSK cells, and CD34–LSK cells 20 minutes after administration of NE (n = 4–6). (H) BM MNCs were obtained from PBS- or NE-treated mice and loaded into transwells. Migration toward 125 ng/ml CXCL12 was assessed for 2 hours. In addition, LK cells were measured among migrating BM MNCs (n = 3–5). *P < 0.05 and **P < 0.01 compared with control (or between ZT5 and ZT13 time points). Ctrl, control.

