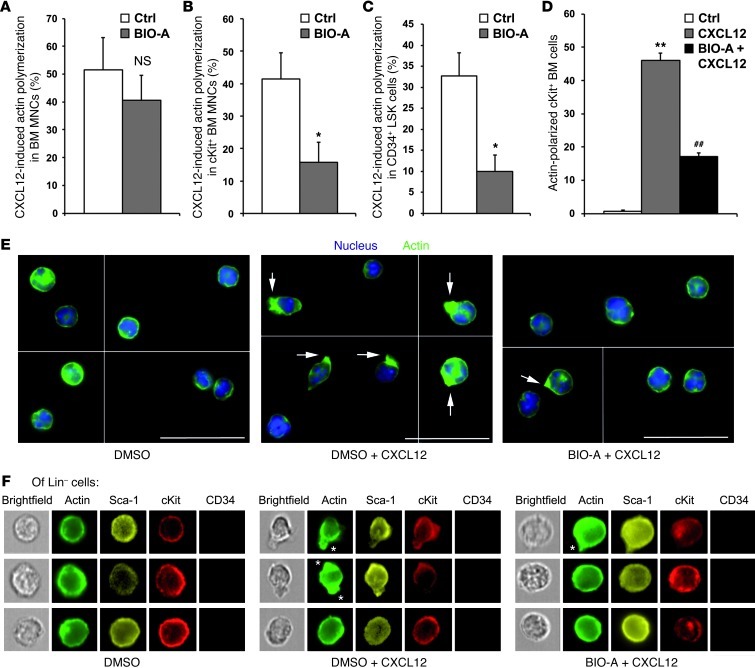
Figure 7. GSK3β signaling regulates actin rearrangement in HSPCs.
(A–C) BM MNCs or Lin– BM cells were pretreated with 1 μM BIO-A or equivalent DMSO for 1 hour and then stimulated with 200 ng/ml CXCL12 for 30 seconds. CXCL12-induced actin polymerization rates were assessed by measuring F-actin content in fixed/permeabilized cells using phalloidin-FITC and flow cytometry. The percentage difference in actin content between nonstimulated cells and stimulated cells equals the actin polymerization rate. CXCL12-induced actin polymerization in BM MNCs (A), cKit+ cells (B), and CD34– LSK cells (C) (n = 5). (D–F) Isolated cKit+ BM cells (D and E) or Lin– cells (F) were pretreated with 1 μM BIO-A or equivalent DMSO for 1 hour and then stimulated or not with 200 ng/ml CXCL12 for 5 minutes. Actin polarization was assessed in fixed/permeabilized cells using phalloidin-FITC. (D) Quantification of polarized cKit+ BM cells by assessing 20 random fields per sample in 2 independent experiments. (E) Representative images of cKit+ cells are shown. Actin is shown in green; arrows point to cell protrusions in response to CXCL12 stimuli. Hoechst indicates cell nuclei (blue). Scale bars: 20 μm. (F) Representative flow cytometry–based single-cell images of CD34– LSK cells as obtained by ImageStream. DMSO: 3 of 3 nonpolarized cells; CXCL12: 2 of 3 polarized cells; BIO-A plus CXCL12: 1 of 3 polarized cells. Asterisks point to cell protrusions in response to CXCL12 stimuli. Original magnification, ×600. *P < 0.05 compared with control; **P < 0.01 compared with control; and ##P < 0.01 compared with CXCL12 stimulation.

