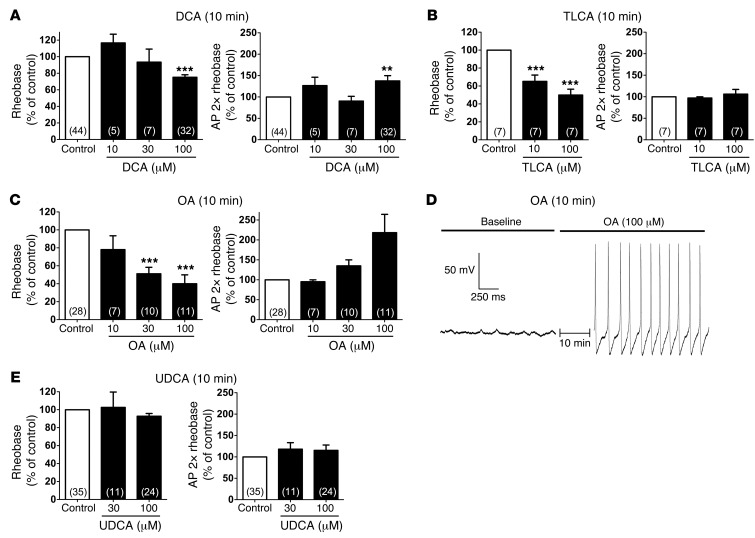
Figure 4. Effects of graded concentrations of BAs and a TGR5 agonist on intrinsic excitability of DRG neurons from C57BL/6 mice.
(A–C and E) Summary data showing rheobase and AP discharge frequency at 2× rheobase. Recordings were made before (control) and after incubation with DCA (A), TLCA (B), OA (C), or UDCA (E) (10, 30, or 100 μM, 10 minutes). Rheobase and AP discharge frequency were normalized to control values to account for variability in control responses between experiments. DCA (100 μM) decreased rheobase and increased AP discharge frequency, whereas TLCA (10 and 100 μM) only decreased rheobase. OA caused a robust and concentration-dependent decrease in rheobase and increase in AP discharge frequency. UDCA had no effect on rheobase or AP discharge frequency. (D) Representative recording of the membrane potential of a neuron immediately before and after incubation with OA (100 μM, 10 minutes). OA exposure resulted in spontaneous AP discharge (no input current). **P < 0.001, ***P < 0.0001 vs. control, 1-way ANOVA and Dunnett post-hoc test. The number of neurons is indicated in parenthesis in each bar. Neurons were obtained from ≥3 mice.

