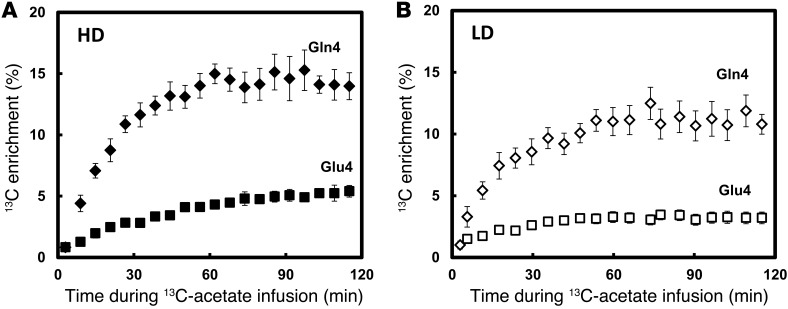
Figure 3. Averaged time courses of the percentage of 13C enrichment of Glu4 and Gln4 for (A) heavy drinkers and (B) light drinkers.
Heavy drinkers showed higher 13C labeling in both Glu4 and Gln4, consistent with greater utilization of acetate. Gln4 is represented by black diamonds and Glu4 is represented by black squares in heavy drinkers. Gln4 is represented by white diamonds and Glu4 is represented by white squares in light drinkers. Values with error bars represent group mean ± SEM.

