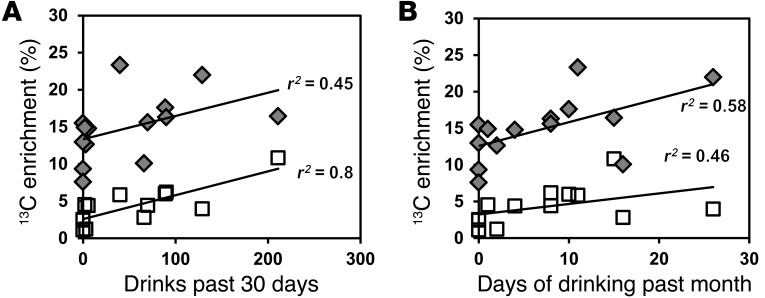
Figure 7. Correlations between glutamate C4 and glutamine C4 enrichments and recent drinking history for both heavy drinkers and light drinkers.
(A) Correlation with drinks in the past 30 days for Glu4 (P = 0.0005) and Gln4 (P = 0.1). (B) Correlation with days of drinking in the past month for Glu4 (P = 0.098) and Gln4 (P = 0.03). Gray diamonds represent Gln4 13C enrichments, and white squares represent Glu4 13C enrichments.

