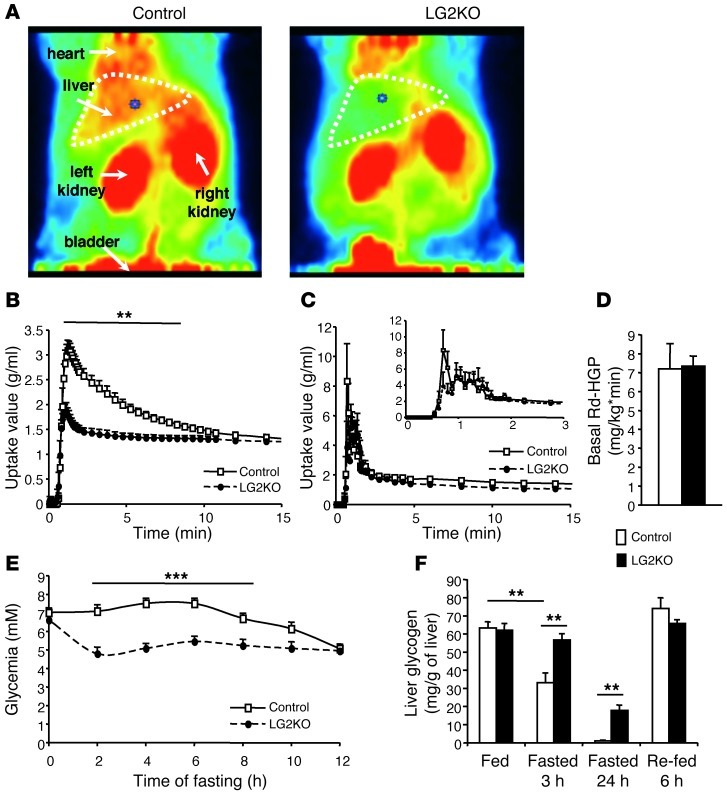
Figure 2. Absence of liver GLUT2 expression suppresses hepatic glucose uptake but does not impair endogenous glucose production.
(A) PET imaging of 18FDG uptake by the liver and kidneys of control and LG2KO mice during the first 15 minutes after injection (dorsal view; red, high uptake; green, low uptake). (B) Kinetics of 18FDG uptake by the liver of control (white squares, n = 6) and LG2KO (black circles, n = 8) mice. Note the suppression of 18FDG uptake between 1 minute and 9 minutes after injection in the liver of LG2KO mice. **P < 0.01 versus control mice. (C) Time-activity curve of 18FDG uptake in the blood of control (white squares, n = 6) and LG2KO (black circles, n = 8) mice acquired by imaging the inferior vena cava. Inset shows expanded view of the same graph from 0 to 3 minutes after tracer injection. (D) Endogenous glucose production by control and LG2KO mice (n = 10). (E) Evolution of blood glucose levels in fasted control and LG2KO mice (n = 9). ***P < 0.001 versus control mice. (F) Evolution of hepatic glycogen content in control and LG2KO mice in the indicated states (n = 5). **P < 0.01. Rd, rate of glucose disappearance; HGO, hepatic glucose output.

