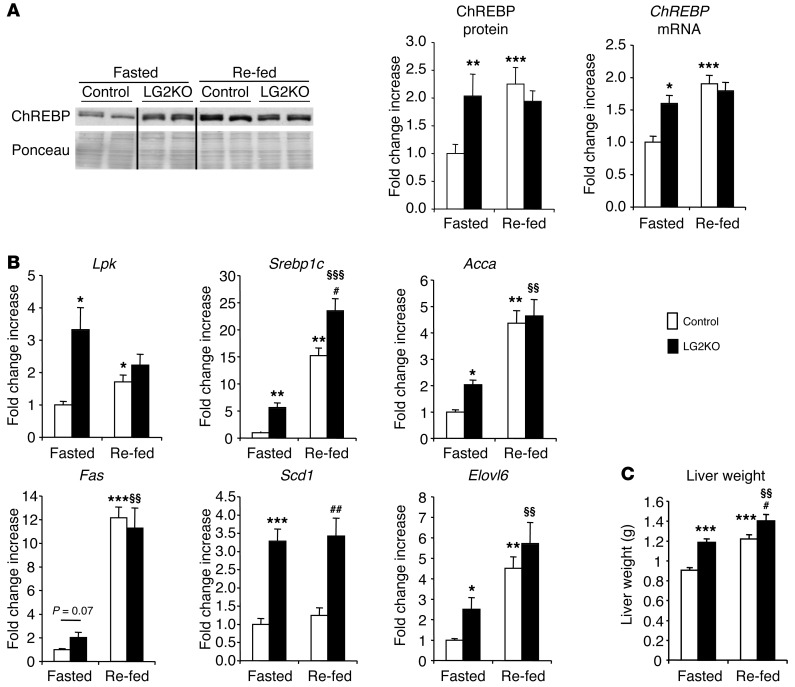
Figure 3. Abnormal regulation of glucose-sensitive genes in the livers of LG2KO mice.
(A) Western blot analysis of ChREBP protein levels in nuclear fractions from the livers of 24-hour–fasted mice (Fasted) and mice re-fed for 6 hours after the end of the 24 hours of fasting (Re-fed). Vertical lines separate nonadjacent lanes from the same blot (left). Quantification of ChREBP protein levels in nuclear fraction, and ChREBP mRNA levels in the liver of fasted and re-fed control and LG2KO mice (n = 6) (right). (B) Levels of expression of the indicated metabolic gene mRNA in the livers of fasted and re-fed control and LG2KO mice (n = 6). (C) Liver weight in fasted and re-fed control and LG2KO mice (n = 12). Data represent the mean ± SEM. *P < 0.05; **P < 0.01; and ***P < 0.001 versus control fasted mice. §§P < 0.01 and §§§P < 0.001 versus LG2KO fasted mice. #P < 0.05 and ##P < 0.01 versus control re-fed mice.

