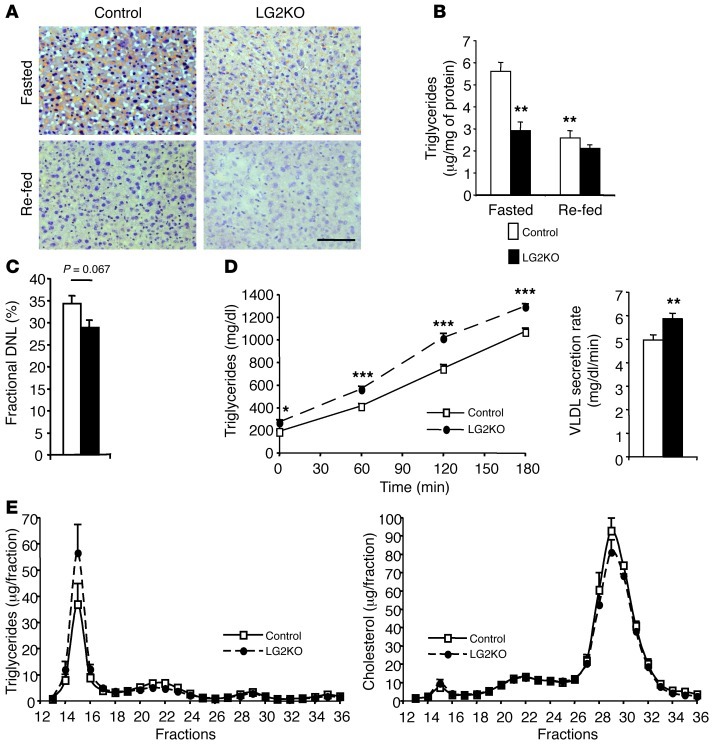
Figure 5. Impaired lipid metabolism in LG2KO mice.
(A) Oil red O staining of liver sections from fasted and re-fed control or LG2KO mice. Scale bar: 50 μm. (B) Quantification of TG storage in the liver of control and LG2KO mice. **P < 0.01 versus control fasted mice. (C) Fractional de novo lipogenesis measured over a 24-hour period. (D) VLDL secretion rates from overnight-fasted control and LG2KO mice. Secreted TG at the indicated time points after tyloxapol injection for control and LG2KO mice (left); rate of TG secretion derived from the left graph (right). *P < 0.05; **P < 0.01; and ***P < 0.001 versus control. (E) Triglycerides (left) and cholesterol (right) contents of FPLC-fractionated plasma from 24-hour–fasted control and LG2KO mice. Data represent the mean ± SEM (n = 6–8).

