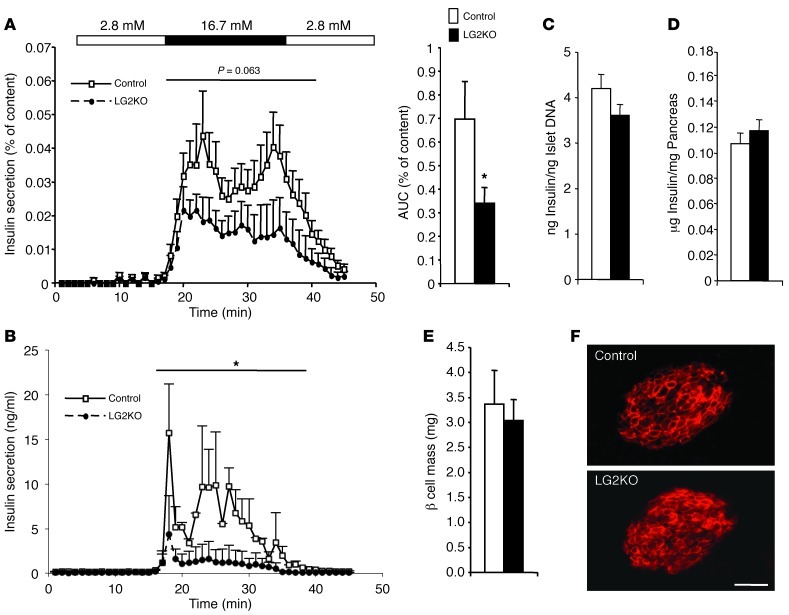
Figure 7. Reduced insulin secretory capacity in islets from LG2KO mice.
(A) Four months after tamoxifen treatment, islets were isolated from control and LG2KO mice and insulin secretion was tested in perifusion experiments using the indicated glucose concentrations. AUC of the insulin secretion activity is represented on the right (n = 7). For AUC: Student’s t test, *P < 0.05 versus control. (B) Pancreas perfusion experiments revealed a reduced secretory capacity of the endocrine pancreas of LG2KO mice (n = 4). A and B (insulin secretion graphs): 2-way ANOVA, *P < 0.05 versus control mice. (C) Insulin per islet DNA (n = 7). (D) Pancreatic insulin content (n = 6), and (E) β cell mass in control and LG2KO mice (n = 4). (F) Immunofluorescence detection of GLUT2 in control and LG2KO pancreatic islets. Scale bar: 30 μm.

