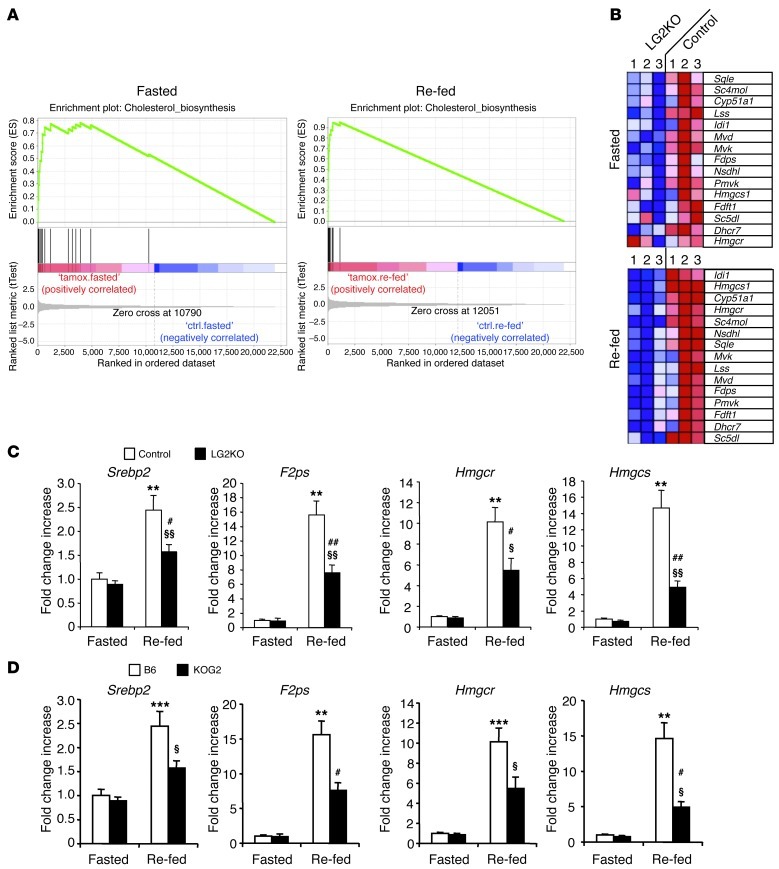
Figure 8. GSEA reveals a decreased expression of cholesterol biosynthesis genes in fasted and re-fed states.
Fasting was for 24 hours and re-feeding was for 6 hours after 24 hours of fasting. (A) GSEA of microarray data from fasted and re-fed control and LG2KO mice reveal enrichment in cholesterol biosynthesis genes in both conditions. (B) Heat map representing the level of expression of genes in the leading edge of the cholesterol biosynthesis gene set (official gene symbols are used). Expression level increases from blue to red. (C) qRT-PCR analysis of the expression of the indicated cholesterol biosynthesis genes in livers of fasted and re-fed control and LG2KO mice. **P < 0.01 versus control fasted mice. §P < 0.05 and §§P < 0.01 versus LG2KO fasted mice. #P < 0.05 and ##P < 0.01 versus control re-fed mice (n = 6). (D) Expression levels of the indicated cholesterol biosynthesis genes in livers of fasted and re-fed C57Bl/6 mice (B6) and mice with constitutive Glut2 knockout (Ripglut1;Glut2–/– mice backcrossed on a B6 background, KOG2). **P < 0.01 and ***P < 0.001 versus B6 fasted mice. §P < 0.05 versus KOG2 fasted mice. #P < 0.05 versus B6 re-fed mice (n = 6).

