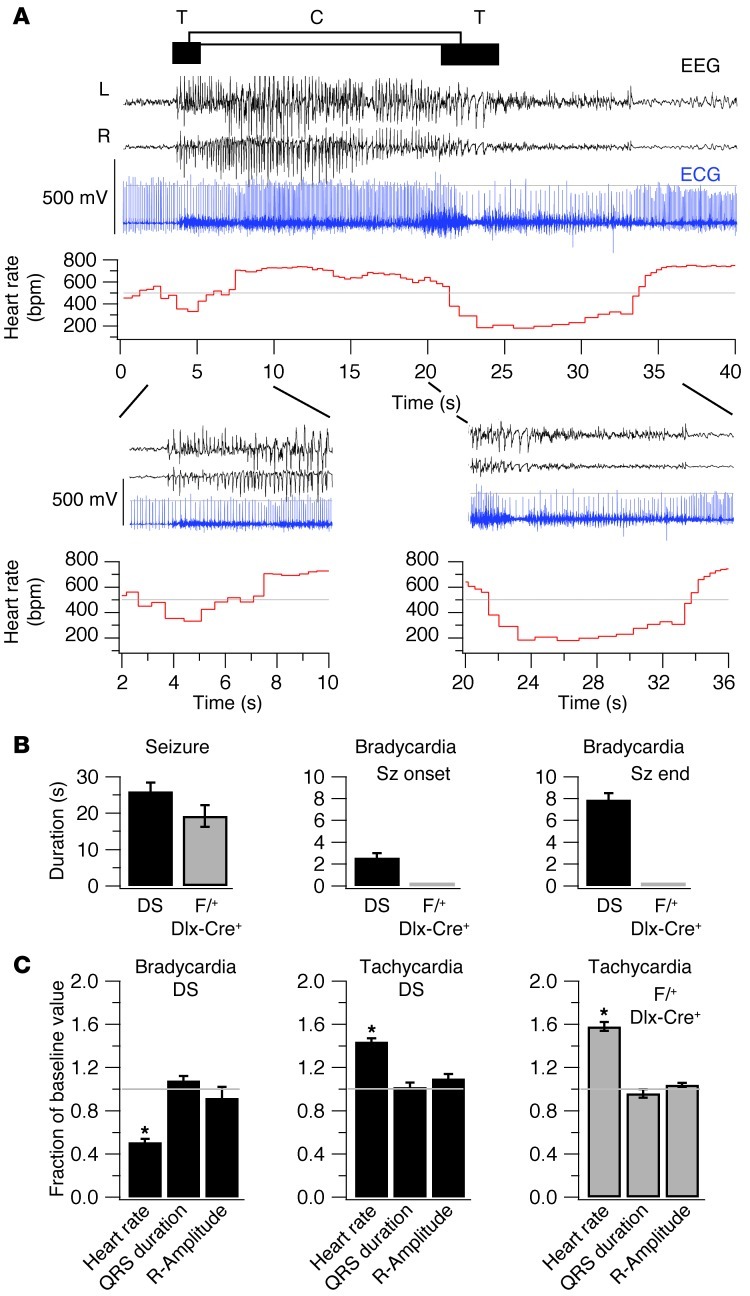
Figure 4. Thermally induced seizures and bradycardia.
Continuous video-EEG-ECG records were obtained before, during, and after thermal seizure inductions in DS and F/+:Dlx-Cre+ mice as described in Methods. (A) Representative combined EEG-ECG records (black, blue) and computed instantaneous heart rate (red). The seizure was characterized by generalized spike-and-wave discharges and Racine 5 generalized tonic-clonic convulsions observed on video. Bradycardia was defined by a fall of instantaneous heart rate more than 1 SD below the mean (gray line). Tachycardias were defined by a rise of instantaneous heart rate more than 1 SD above the mean. Horizontal bars indicate the tonic (T) and clonic (C) phases of the seizure. (Lower traces) Magnified segments of records containing ictal bradycardias. (B) Seizure and bradycardia durations in 19 DS mice (black) and 5 F/+:Dlx-Cre+ (gray) mice that did not die. Left shows seizure (sz) durations: 26 ± 2.4 ms for deaths; 19.2 ± 3.0 ms for survivors. Middle and right show bradycardia durations: 2.6 ± 0.4 ms, seizure onset; 7.9 ± 0.6 ms, seizure termination in survivors. No bradycardia was observed in F/+:Dlx-Cre+ survivors. (C) Fractional changes in ECG intervals caused by thermal seizures in 19 DS (black) and 5 F/+:Dlx-Cre+ (gray) survivors, calculated as ratio of ictal bradycardia/baseline values. Left shows bradycardia in DS mice. QRS duration, 1.08 ± 0.04; R wave amplitude, 0.92 ± 0.1. Middle shows tachycardia in DS mice. QRS duration, 1.02 ± 0.04; R-wave amplitude, 1.1 ± 0.04. Right shows tachycardia in F/+:Dlx-Cre+ mice. QRS duration, 0.96 ± 0.04; R wave amplitude, 1.04 ± 0.02. No bradycardia was observed in F/+:Dlx-Cre+ survivors. *P < 0.05.

