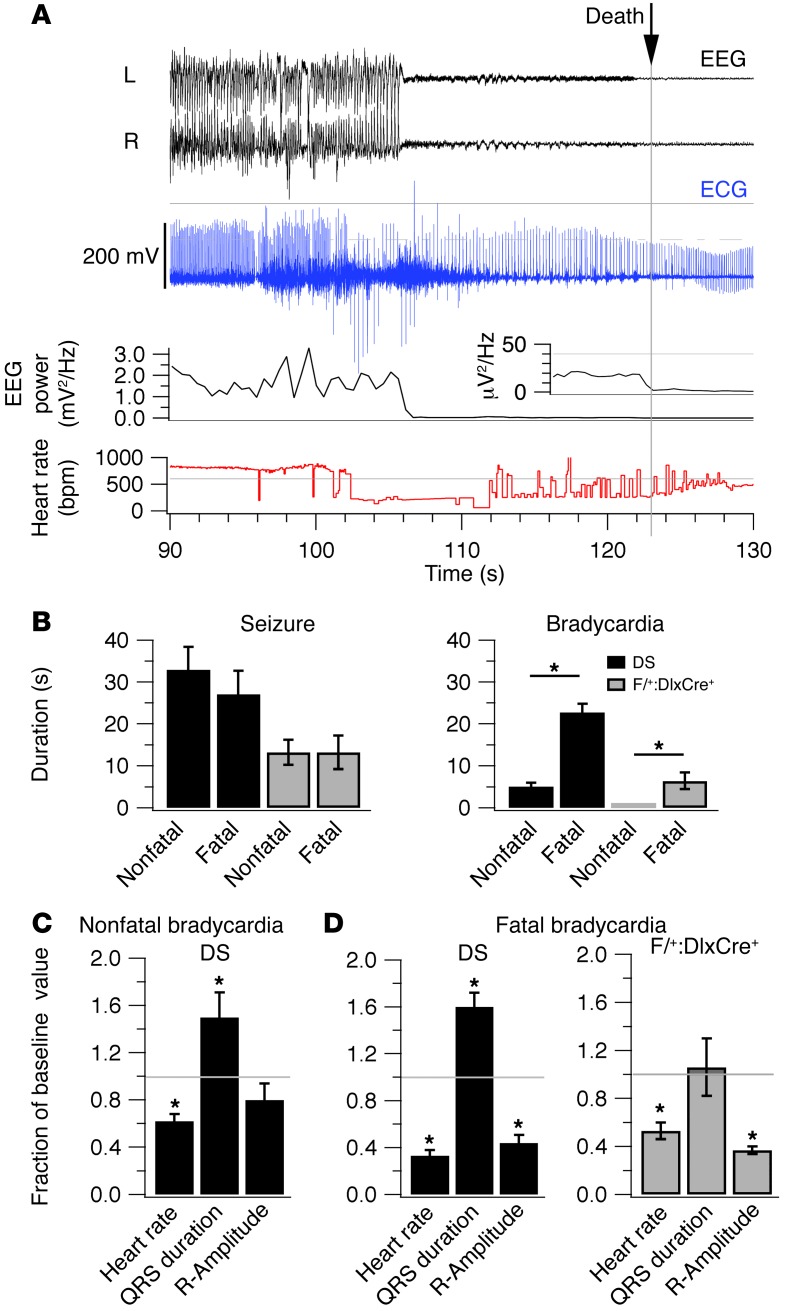
Figure 5. Ictal bradycardia and premature death.
(A) Representative traces of EEG-ECG records (black, blue), instantaneous heart rate, and instantaneous EEG power before death, illustrating the seizure and bradycardia preceding death. Time of death was defined as the moment when the power of the EEG fell to zero value, which coincided with cessation of ambulatory and respiration movements. Inset shows magnification of power trace below. (B) Left shows seizure durations in 4 DS (black) and 4 F/+:Dlx-Cre+ mice (gray) that died. In DS mice, the duration of seizures was 32.9 ± 5.5 ms for fatal seizures vs. 27.1 ± 5.6 ms for nonfatal seizures (P > 0.05). In F/+:Dlx-Cre+ mice, duration was 13.2 ± 3.0 for fatal seizures vs. 13.2 ± 4.0 ms for nonfatal (P > 0.05). Right shows bradycardia duration. DS mice, 22.8 ± 2.0 ms in fatal seizures vs. 5.1 ± 1.0 ms in nonfatal ones; F/+:Dlx-Cre+ mice, no nonfatal seizures; bradycardia duration for fatal seizures, 6.4 ± 2.0 ms. (C) Fractional changes in ECG parameters during nonfatal bradycardia in DS mice (n = 4), calculated as the ratio ictal bradycardia/baseline. (D) Fractional changes in ECG parameters in fatal bradycardia. Left shows DS mice (n = 4). Right shows F/+:Dlx-Cre+ mice (n = 4). *P < 0.05.

