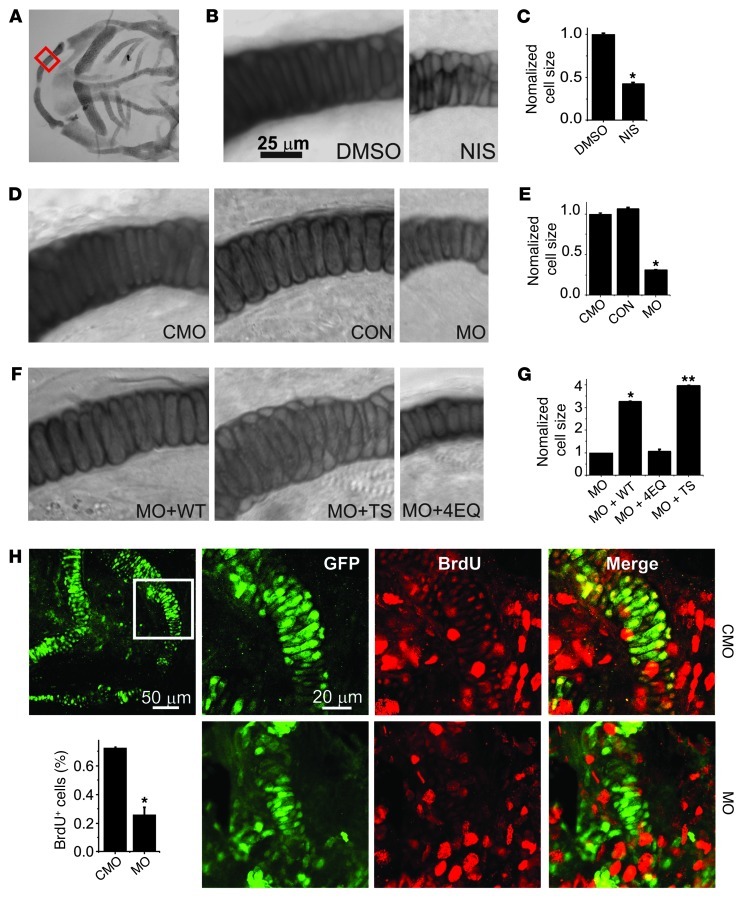
Figure 4. Ca2+ influx through CaV1.2 affects cellular hypertrophy and hyperplasia in the mandible.
(A) Low-power DIC image of flat-mounted, Alcian blue–stained CON embryo. The red box indicates the region from which images in B, D, and F were obtained. (B) Higher magnification of the region shown in A for an embryo treated with DMSO or NIS. (C) Cell size normalized to DMSO (n = 20 for each). *P < 0.001 versus DMSO. (D) Higher magnification of the region shown in A for a CON, CMO, or MO embryo. (E) Cell size normalized to CMO (n = 20 for each). *P < 0.001 versus CMO. (F) Higher magnification of the region shown in A for an MO + WT, MO + TS, or MO + 4EQ embryo. (G) Cell size normalized to MO (n = 20 for each). *P < 0.001 versus MO; **P < 0.001 versus MO + WT or versus MO. (H) BrdU staining and quantification of BrdU+ cells (in GFP+ cells) of sox10+ zebrafish embryos treated with CMO or MO. *P < 0.001. Note that we were unable to use 1-phenyl 2-thiourea, the tyrosinase inhibitor commonly used to block pigmentation and aid visualization (for BrdU staining) in zebrafish because it interferes with neural crest development (32): the larger red nuclei likely denote newly produced melanocytes, which migrate to the same area, and were not counted.

