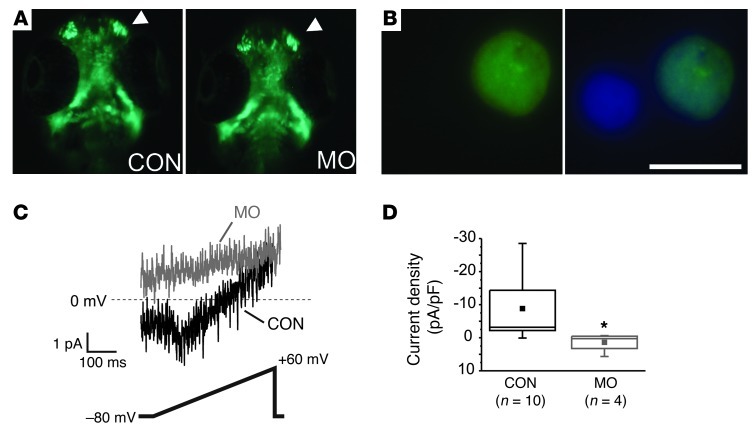
Figure 6. sox10+ cranial neural crest–derived cells express functional CaV1.2 channels.
(A) GFP images of decapitated sox10-GFP transgenic embryos at approximately 65 hpf of a control or CaV1.2 MO embryo. Arrowhead denotes migrating cranial neural crest. (B) Sample GFP+ cell after single-cell isolation. Image on the right shows a DAPI overlay. Note the GFP– cell. (C) Whole-cell Ca2+ current from a GFP+ cell isolated from an MO or CON embryo. Voltage ramp protocol shown below. (D) Box plot showing current density for MO or CON embryos. *P < 0.01. Scale bar: 5 μm.

