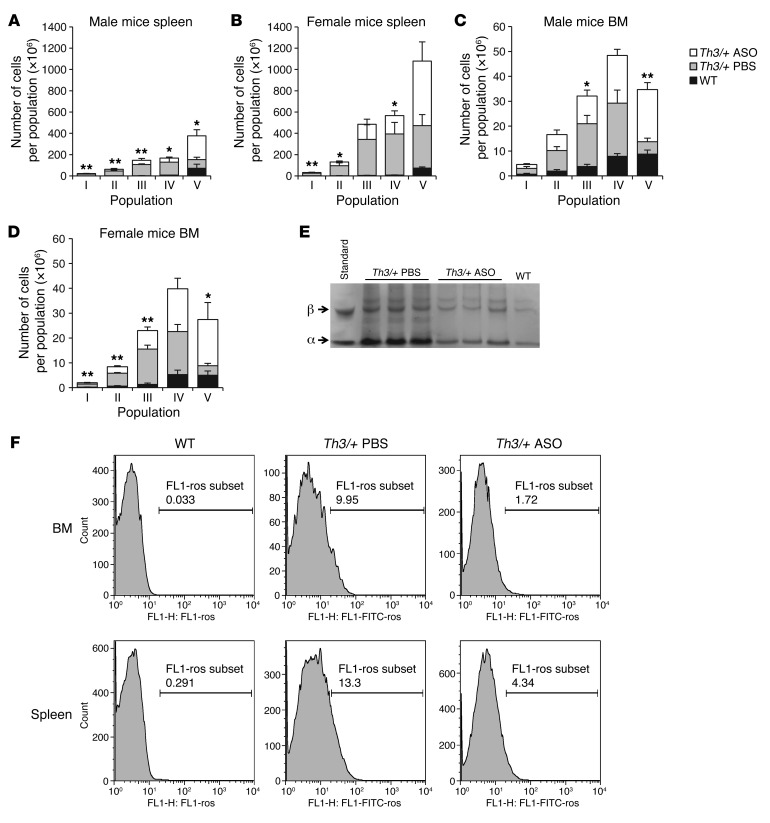
Figure 5. Tmprss6-ASO treatment in th3/+ mice improved IE.
(A) FACS analysis to discriminate different stages of erythroid differentiation in the spleen using the Ter119 and CD44 antibodies. This assay allows the separation of erythroid cells into distinct populations corresponding to proerythroblasts (fraction I), basophilic (II), polychromatic (III), orthochromatic cells, and reticulocytes (IV), and mature rbc (V). Absolute numbers of the different stages of erythroid cells are shown in the spleen in male (A) and female mice (B) and in the BM in male (C) and female mice (D). (E) TAU gel electrophoresis. (F) ROS analysis by FACS, showing a representative sample of the percentage of ROS-positive cells in fraction V. Results represent mean ± SD. n = 4 for male mice in each group; n = 4 and 5 for female mice in control and treatment groups, respectively. *P < 0.05; **P < 0.01 by Student’s t test when treatment group was compared with vehicle control group.

