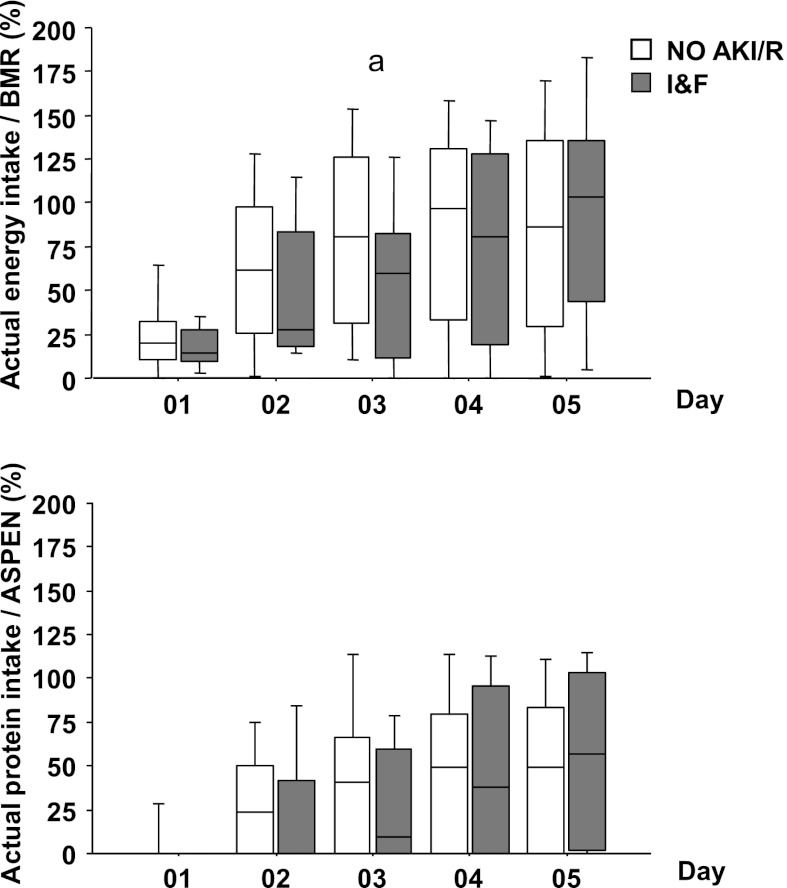
Figure 1.
Actual energy and protein intake as a percentage of recommended needs on days 1–5. Actual intake as a percentage of recommended energy (Schofield) (top) and protein needs (bottom) in no AKI/risk (No AKI/R) and injury/failure (I/F) groups on days 1–5. No AKI/R, n=146 for days 1–4 and n=138 for day 5; I/F, n=21 for days 1–4 and n=19 for day 5. Box plots are medians (25th–75th percentiles) and 95% confidence intervals. aI/F versus No AKI/R. Mann–Whitney test (P<0.03).

