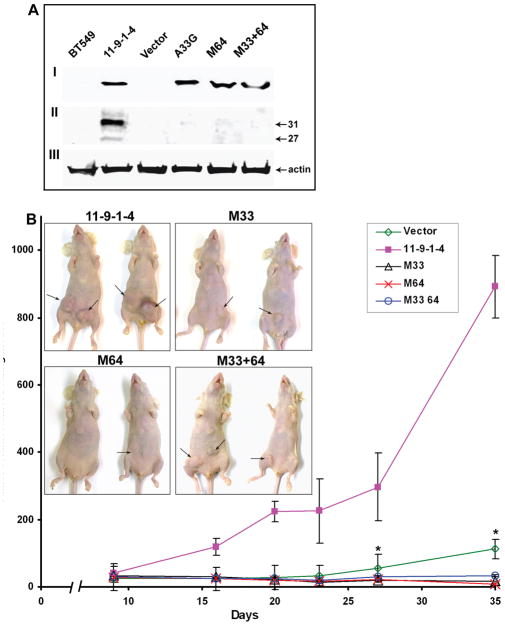
Figure 2.
A: Expression of galectin-3 in BT-549 cell transfectants: I: Galectin-3 expression in total cell lysates. Fifty μg total protein was loaded per lane. II: Galectin-3 expression in the conditioned medium. 50μg protein was loaded per lane. Note the presence of an additional band of ~27 kDa in 11-9-1-4. III: Actin was used as a loading control for cell lysate.
B: Tumorigenicity of various BT-549 transfected cell clones in nude mice: Each point is the average of the tumor volume in tumor bearing mice. The bars represent standard error. p values with respect to 11-9-1-4 on day 35 were 0.0071, 0.0036, 0.0036 and 0.0042 and on day 27 were 0.0099, 0.0048, 0.0050, and 0.0060 respectively for vector, M33, M64 and M33+64 respectively. Inset: pictures of representative mice at the time of sacrifice. Arrows indicate tumors.

