Figure 3.

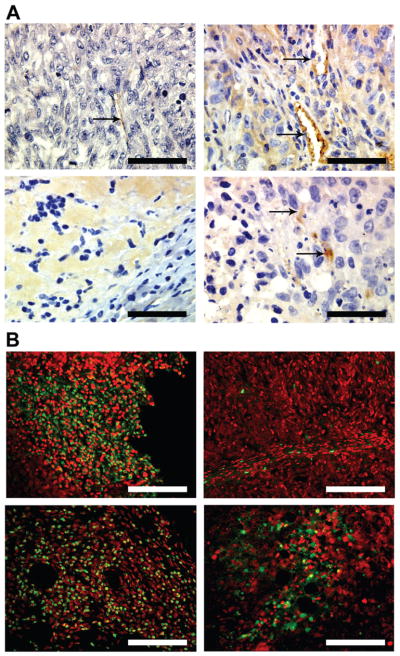
Figure 3A: Angiogenesis in the xenografts: The sections were stained with anti-CD34 to identify the blood vessels. Top left: Vector; Top right: 11-9-1-4; Bottom left: M33; Bottom right: M33+64. Arrows indicate positive staining. Bar: 200 micron.
B: TUNEL assay in the xenografts: Top left: Vector; Top right: 11-9-1-4; Bottom left: M33; Bottom right: M33+64. Green color represents the apoptotic nuclei. Bar: 100 micron
