
Figure 5.
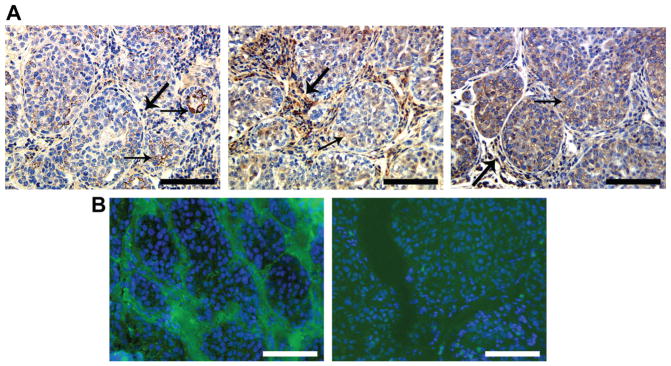
Distribution of full length and cleaved galectin-3 in MCF10 DCIS.com xenograft: A: paraffin embedded; B: fresh frozen. A: left: monoclonal anti galectin-3 antibody shows mainly epithelial and some stromal labeling (arrows); middle: polyclonal anti-galectin-3 antibody shows some epithelial (arrow) and strong stromal labeling (wider arrows); right: anti-MMP-9 antibody showing epithelial (arrow) and stromal (wider arrow) labeling. B: left: In situ zymography in the fresh frozen section showing stromal activity (green color), nuclei were stained with DAPI (blue color); right: In situ zymography in the presence of 20mM EDTA. Bar: 100 micron.