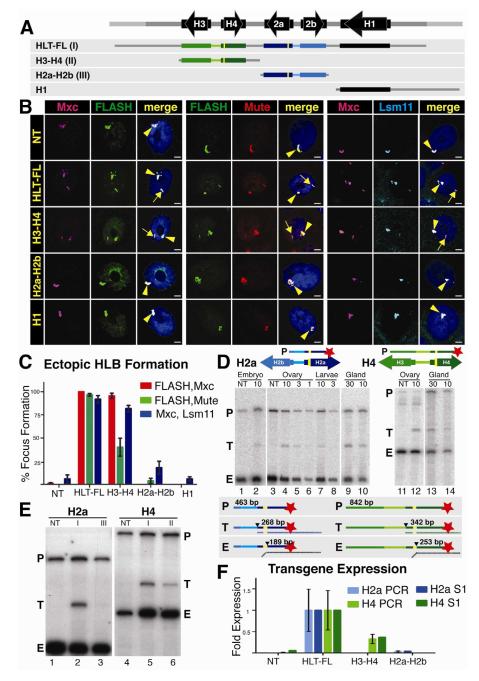
Fig 2. The H3-H4 genes assemble an ectopic HLB.
A. Diagram of the four constructs inserted into chromosomal location 86Fb. The yellow bars represent N-terminal FLAG tags in H2a and H4.
B. HLB assembly for each construct (indicated at left) was assessed by confocal microscopy of intact salivary gland nuclei stained with Mxc and FLASH (left), Mute and FLASH (center) or Mxc and Lsm 11 (right). The endogenous HLB contained Mxc (pink), FLASH (green), Mute (red) and Lsm11 (blue) in all samples (arrowhead). Note the assembly of an ectopic HLB with each marker for nuclei containing the HLT-FL or the H3-H4 transgenes (arrow). Scale bar indicates 10 μm.
C. Quantification of ectopic HLB formation. Error bars depict SEM.
D. Expression of histone mRNA from the HLT-FL transgene was assessed throughout development by 5′ S1 nuclease protection assay using a 32P end-labeled (red star) probe (P) complementary to either the H2a or H4 endogenous and ectopic transcripts. Numbers above the gel indicate the amount PTE of RNA (μg, except glands which were total number of glands) in each reaction. The S1 nuclease assay is diagrammed below the gel. Numbers indicate the length in nt of the probe (P), ectopic (T) and endogenous (E) protected H2a or H4 transcripts. The black triangle indicates nuclease cleavage of the probe at the point where the RNA (vertical dashed line below probe) is not complementary.
E. Expression of histone mRNA was assessed in salivary glands by 5′ S1 nuclease protection assay. Roman numerals indicate the transgene inserted in each sample (depicted in A). Note that ectopic histone expression (T) was detected from constructs carrying HLT-FL and H3-H4.
F. Relative histone mRNA expression was measured for H2a (light blue columns) and H4 (light green columns) by qRT-PCR and quantification of the S1 protection assay (dark columns). Both assays are presented as fold expression compared to HLT-FL, which was set at 1.0. Error bars depict SEM.

