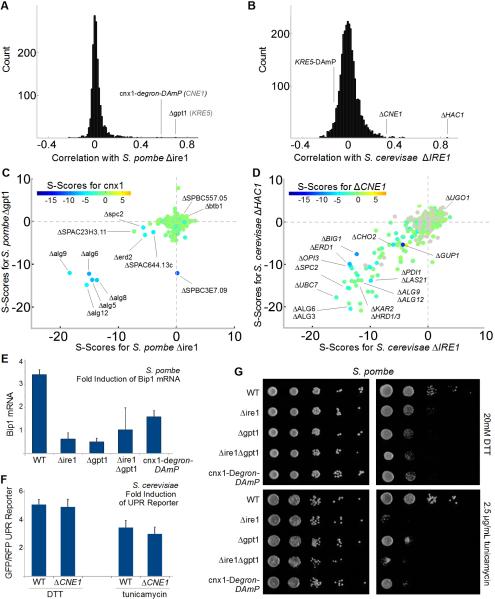
Figure 3. the UPR Depends on Gpt1/Cnx1 and Ire1.
(A) Distribution of correlation coefficients for Sp Δire1 compared with (B) distribution of correlation coefficients for Sc ΔIRE1 (when different, names for Sc orthologs in gray text). (C) 3D scatter plot for Sp scores comparing Δire1 with Δgpt1 on the x and y axes, respectively, and the calnexin ortholog, cnx1-degron-DAmP, color coded according to the inset scale. (D) 3D scatter plot for Sc scores comparing ΔIRE1 with ΔHAC1 on the x and y axes, respectively, and the non-essential calnexin ortholog, ΔCNE1, color coded according to the inset scale. (E) Fold induction of normalized bip1 mRNA levels by qPCR in ER stress-inducing conditions. Each bar is the mean of three biological and three technical replicates per strain per condition. (F) Fold induction of GFP/RFP ratios in cells harboring a reporter system in which a Hac1p-responsive promoter drives green fluorescent protein corrected for nonspecific expression changes by comparing GFP to co-expressed RFP from a constitutive (TEF2) promoter (Jonikas et al 2009). Error bars = S.D. (G) Growth sensitivity of the indicated Sp strains to 20mM DTT or 2.5μg/mL tunicamycin.

