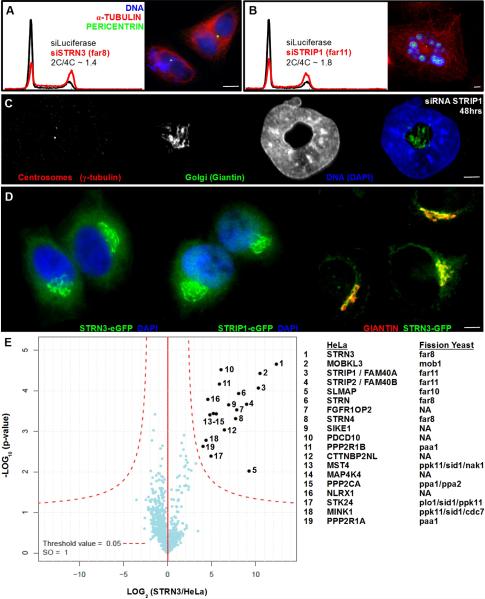
Figure 6. Striatins and STRIPs form a Complex at the Golgi that Regulates Mitosis.
(A,B) Flow cytometry analysis showing DNA content histograms of HeLa cells treated with control siRNA targeting Luciferase (black) or siRNAs to deplete STRIPAK complex subunits (red). HeLa cell depletions revealing multinucleate cells and fragmented nuclei. (C) HeLa cell depleted of STRIP1 (Far11) for 48 hours. Fluorescence staining shows centrosomes (red), Golgi (green) and nuclei (blue). (D) HeLa cells harboring bacterial artificial chromosomes for eGFP-tagged STRN3 (Far8) or STRIP1 (Far11), demonstrating Golgi-like morphology and colocalization with the Golgi resident protein GIANTIN (red). See Fig S6 for additional colocalizations after siRNA depletion. (E) Volcano plot representation of STRN3-interacting proteins. For each protein identified by IP-MS, the ratio of the intensities in the STRN3 IPs over the control was calculated and plotted against the p-value of a t-test calculated from triplicates. The red curve is a cutoff calculated from false discovery rate estimation.

