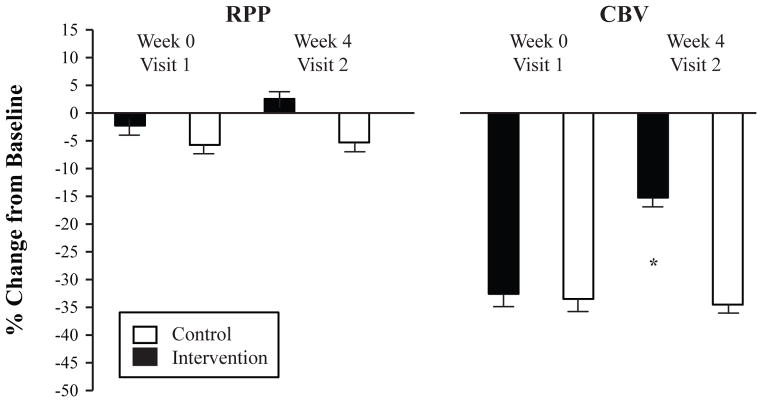
Figure 2.
Percent change (baseline to hyperoxia) in rate pressure product (RPP, an index of myocardial oxygen demand) and coronary blood flow velocity (CBV, an index of myocardial oxygen supply) in obese adolescents. Both the Intervention (black bars) and Control (white bars) groups underwent baseline measurements and then 100% oxygen breathing on Week 0 (Visit 1) and Week 4 (Visit 2). *indicates significantly attenuated coronary vasoconstriction in the Intervention group compared to Control group at Week 4. Values are mean ± SEM (N = 6 in each group).

