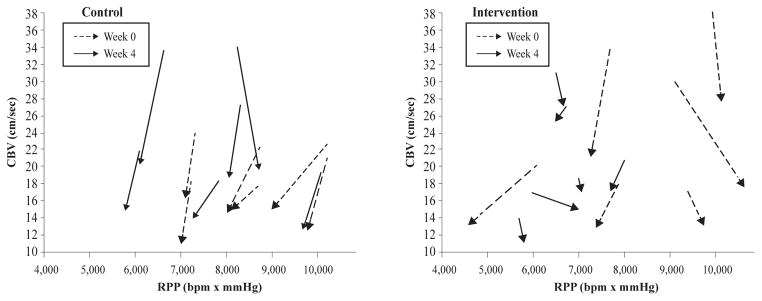
Figure 3.

Individual coronary blood flow velocity (CBV) responses to 100% oxygen breathing (hyperoxia) plotted with respect to rate pressure product (RPP) for both Control (left panel) and Weight Loss Intervention (right panel) group at Week 0 (Visit 1, dashed lines) and Week 4 (Visit 2, solid lines). The arrows point from baseline to hyperoxia. A decrease in CBV at a relatively stable RPP is considered to be evidence of coronary vasoconstriction; a shorter arrow is therefore blunted vasoconstriction.
