. 2013 Apr 2;2:e00278. doi: 10.7554/eLife.00278

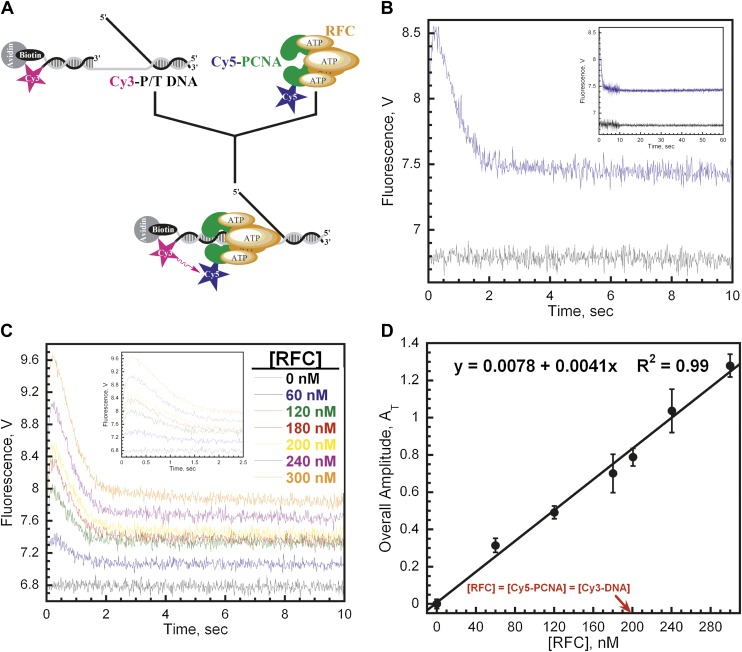
Figure 2. RFC loads PCNA with rates independent of RFC concentration.

(A) Schematic representation of experimental procedure for Figure 2B. (B) Cy5-PCNA (200 nM) was incubated with RFC (200 nM) in the presence of 1 mM ATP. This preformed RFC•Cy5-PCNA•ATP complex was mixed with Cy3-P/T DNA (200 nM) in a stopped-flow instrument and the FRET signal was followed (Blue trace). The loading traces were fit to a double-exponential equation. If RFC was omitted, no FRET signal was observed (Black trace). An extended time course of 60 s is shown in the inset. (C) The experiments depicted in Figure 2A were also performed with varying concentrations of either RFC (0–300 nM) or ATP (0–5 mM). Shown in panel C is the RFC titration of the FRET signal. The initial 2.5 s of the FRET traces is shown in the inset. The loading traces were fit to double-exponential equations and the respective rate constants for the fitted FRET increases and decreases are presented as a function of [RFC] in Figure 2—figure supplement 1. The ATP titration of the FRET signal is presented in Figure 2—figure supplement 2. (D) The overall amplitude of the signal (sum of all amplitudes) from Figure 2C plotted against [RFC].

DOI: http://dx.doi.org/10.7554/eLife.00278.007

Figure 2.

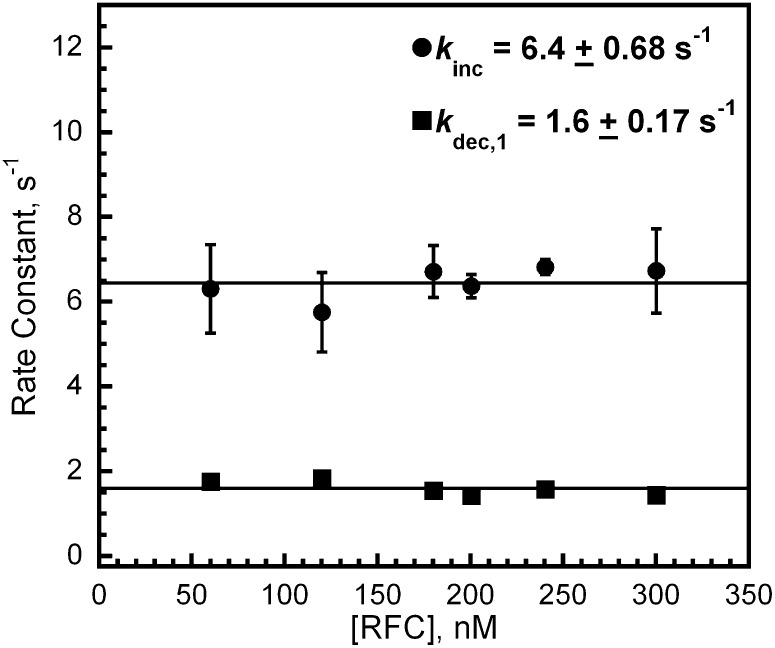
Figure 2—figure supplement 1. RFC loads PCNA with rates independent of RFC concentration.

Figure 2—figure supplement 1.

The respective rate constants of the fitted FRET increase (kinc) and decrease (kdec,1) from Figure 2C as a function of [RFC].
Figure 2—figure supplement 2. RFC-catalyzed loading of PCNA is dependent upon ATP.

Figure 2—figure supplement 2.

(A) and (B) Experiments were performed as depicted in Figure 2A with varying concentrations of ATP (0–5 mM). Loading traces were fit to double-exponential equations and the rate constants for the fitted FRET increase, kinc (shown in panel A), and FRET decrease, kdec,1 (shown in panel B), were plotted against [ATP]. In the absence of ATP, no FRET signal was observed (data not shown). (C) Experiments were performed as depicted in Figure 2A in the presence of 1 mM ATPγS. The loading traces (black) were overlaid on corresponding traces from Figure 2B performed at 1 mM ATP (grey). The loading traces were fit to a double-exponential equation with rate constants of 0.16 ± 1.3 × 10⁻² s−1 and 1.1 × 10⁻² ± 6.2 × 10⁻⁴ s−1 for the fitted fast and slow phases.