
Figure 1.
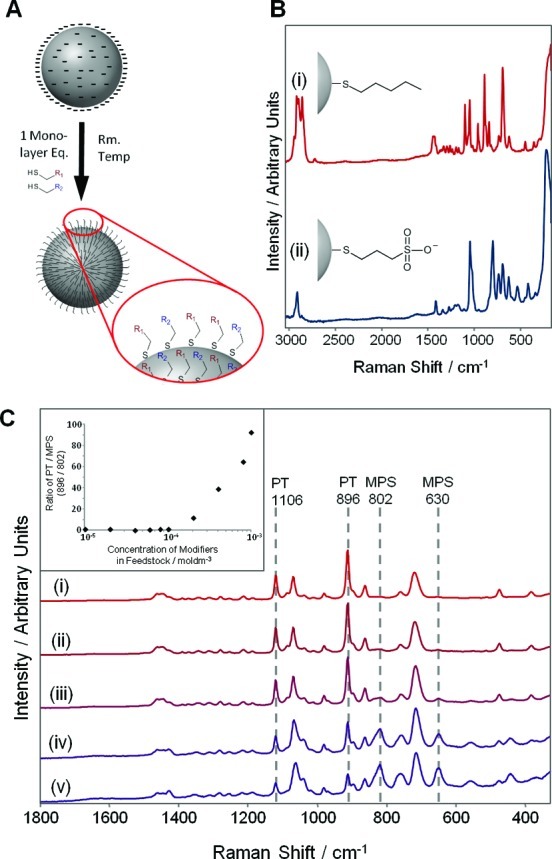
(A) Modification of a preprepared silver nanoparticle with a mixed thiol feedstock. (B) SERS spectra of (i) PT and (ii) MPS adsorbed on HRSC. (C) SERS spectra of 1:1 mixtures of MPS and PT added to HRSC at total modifier concentrations of (i) 1 × 10⁻³ M, (ii) 4 × 10⁻⁴ M, (iii) 2 × 10⁻⁴ M, (iv) 1 × 10⁻⁴ M, and (v) 6 × 10⁻⁵ M. Spectra have been scaled and vertically offset to emphasize the change in the relative intensities of MPS and PT bands. (Inset) Semilog plot of the ratios of the heights of PT (896 cm–1) and MPS (802 cm–1) bands against total modifier concentration.