
Figure 2.
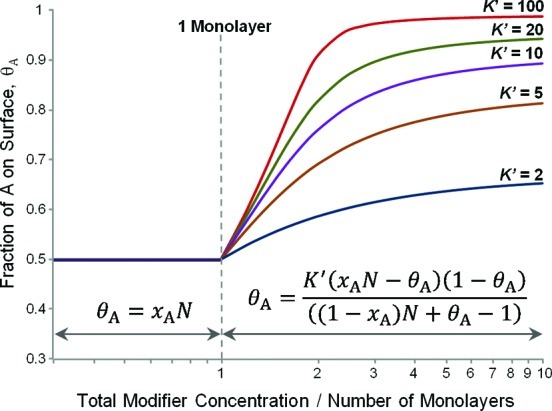
Predicted fractional surface coverage, θA, given by a 1:1 A:B feedstock with changing total modifier concentration. Simulations at different values of K′, the ratio of binding constants between the modifiers A and B, are shown. Above monolayer concentrations, the fractional coverage of A increases according to the value of K′; below monolayer concentrations, the fractional coverage of A will be 0.5 regardless of the value of K′.