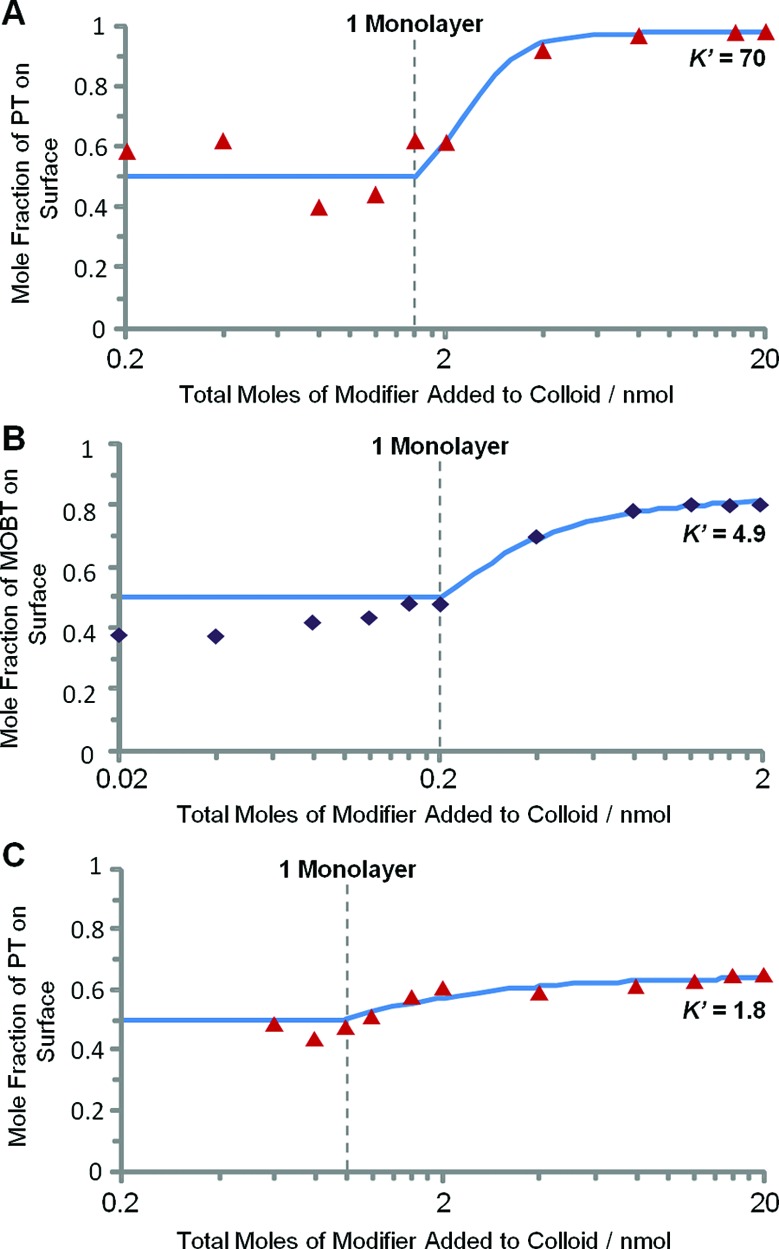
Figure 3.

Plots showing how the surface mole fractions of various modifiers adsorbed from 1:1 binary modifier mixtures change with total amount of modifier. Solid lines are the fits to the competitive binding model discussed in the text. Plots show the fractions of (A) PT adsorbed from a PT:MPS feedstock on HRSC, (B) MOBT from a MOBT:TP feedstock on Ag nanoprisms, (C) PT from a PT:BZM feedstock on CRSC. 200 μL of silver colloid was used in each case.
