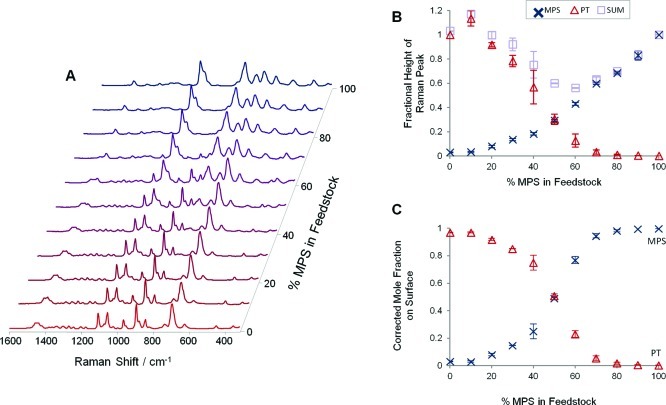
Figure 4.
(A) SERS spectra of HRSC modified using mixed MPS:PT feedstocks with different percentages of MPS, but where the total modifier concentration was kept constant at 1 × 10⁻⁴ M. Spectra are normalized to the highest peak for clarity. (B) Chart showing the fractional height of MPS (802 cm–1, ×) and PT (896 cm–1, Δ) along with the sum of these. (C) Plot of the mole fractions of MPS (×) and PT (Δ) obtained by correcting the fractional heights shown in (B). Error bars are ±1 s, calculated from 3 replicate experiments.

