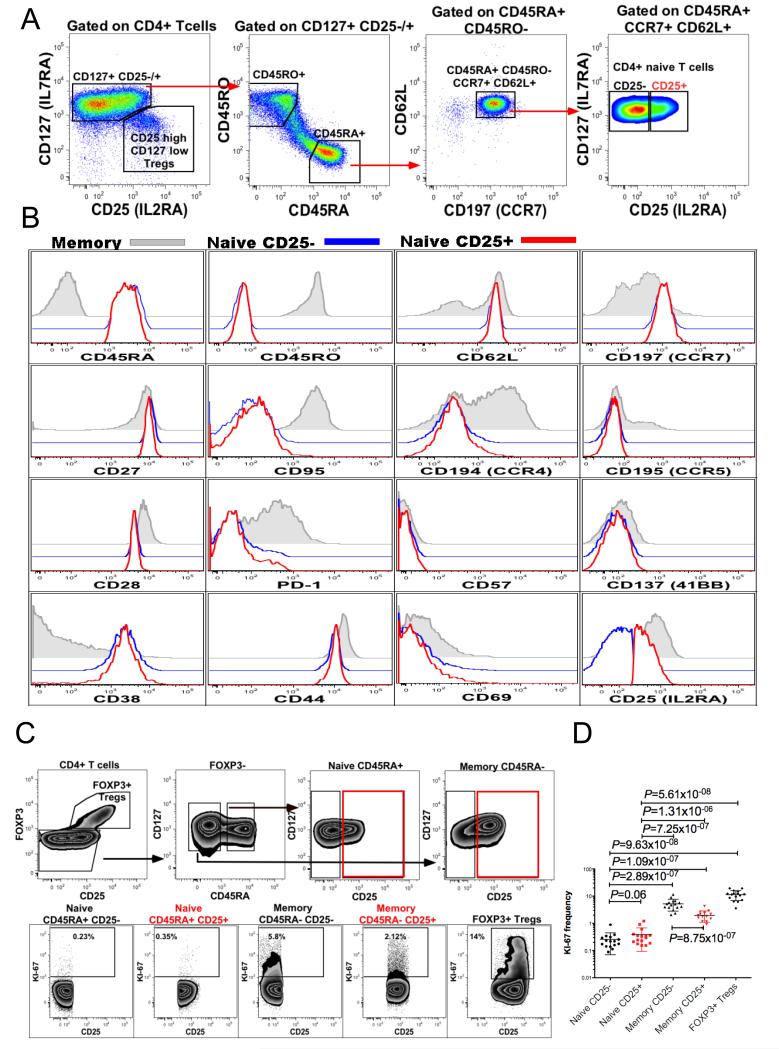
Fig. 2. Immunophenotyping of CD25+ and CD25− naïve CD4+ T cells.
(A) Gating strategy used to define the CD25+ and CD25− subsets of human peripheral blood CD4+, CD45RA+, CD45RO−, CCR7+, CD62L+ naïve T cells (representative of 20 donors). (B) Representative examples of flow cytometric analyses of CD25+ and CD25− naïve CD4+ T cell subsets: overlaid histograms show the expression of the indicated molecule in three CD4+ T cell subsets defined as memory CD45RA− CD45RO+ (grey solid histogram), naïve CD45RA+ CD45RO− CD62L+ CD25− (blue histogram) and naïve CD45RA+ CD45RO− CD62L+ CD25+ (red histogram), representative example of between 5 and 20 donors. (C) Gating strategy to assess the proportion of cells in cycle (Ki-67+) within various CD4+ T cell subsets: CD25−/+ CD45RA+ FOXP3− naïve CD4 T cells, CD25−/+ CD45RA− FOXP3− memory CD4 T cells and CD25high Tregs. (D) Combined analysis of Ki-67+ T cell frequency in five CD4 T cell subsets in 16 donors.

