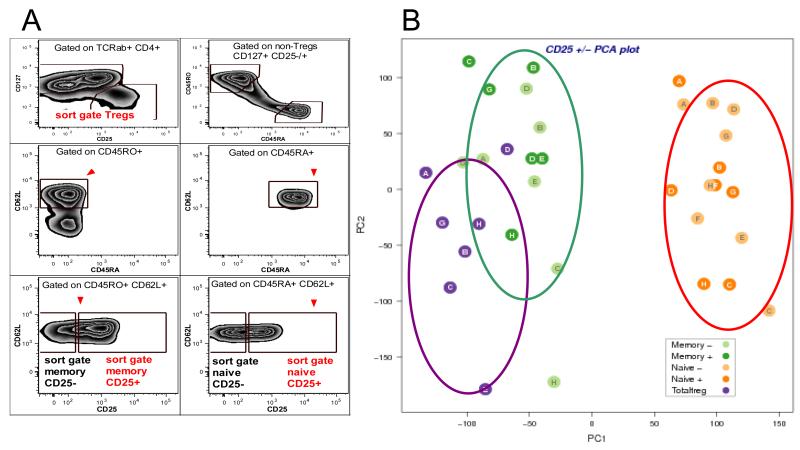
Fig. 3. Principal component analysis of CD4+ CD25+ naïve T cells confirm their naïve gene expression profile.
(A) CD4+ T cells purified from peripheral blood were labelled with antibodies to TCRαβ, CD4, CD127, CD25, CD45RA, CD45RO, CD62L and five subsets of CD4+ T cells were sorted as follows: naïve CD25− (TCRαβ+, CD4+, CD127+, CD45RA+, CD62L+, CD45RO−, CD25−), naïve CD25+ (TCRαβ+, CD4+, CD127+, CD45RA+, CD62L+, CD45RO−, CD25+), memory CD25− (TCRαβ+, CD4+, CD127+, CD45RA−, CD62L+, CD45RO+, CD25−), memory CD25+ (TCRαβ+, CD4+, CD127+, CD45RA−, CD62L+, CD45RO+, CD25+) and Tregs (TCRαβ+, CD4+, CD127−/low, CD25high). (B) Principal component analysis (PCA) of five CD4+ T cell subsets purified from 7 donors delineated by a 96-sample titan Affymetrix Human Gene 1.1 ST array. The Human Gene 1.1 ST Array Plate interrogates more than 28,000 well annotated genes with more than 750,000 distinct probes. The array provides deep exon coverage and contains a median of 26 probes per gene. PCA analysis indicated that the CD25− and CD25+ naïve T cell subsets cluster together and their expression profiles are both different from both memory T cells and Tregs.

