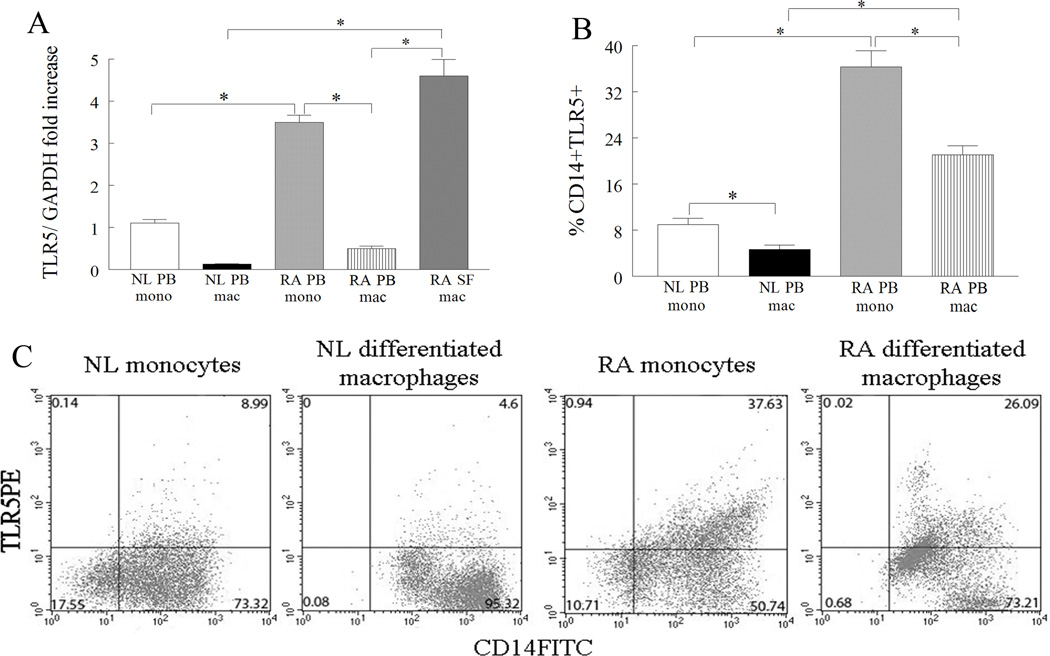
Figure 2. TLR5 is upregulated in RA synovial fluid (SF) compared to RA and NL PB macrophages.
A. TLR5 mRNA levels were determined in NL (n for monocytes or macrophages=11 or 18) and RA PB monocytes (n=11) and differentiated macrophages (n=15) as well as in RA SF macrophages (n=10) by employing real-time RT-PCR. The data are shown as fold increase above NL PB monocytes and are normalized to GAPDH. B. Normal and RA PB monocytes and differentiated macrophages were immunostained with CD14 labeled with FITC and TLR5 conjugated with PE in order to determine % TLR5 positive cells (n=6–10). The values are presented as mean ± SEM of % CD14+TLR5+ in each cell population. C. Representative flow cytometry histograms showing CD14+TLR5+ in NL and RA PB monocytes and differentiated macrophages. * represents p<0.05.

