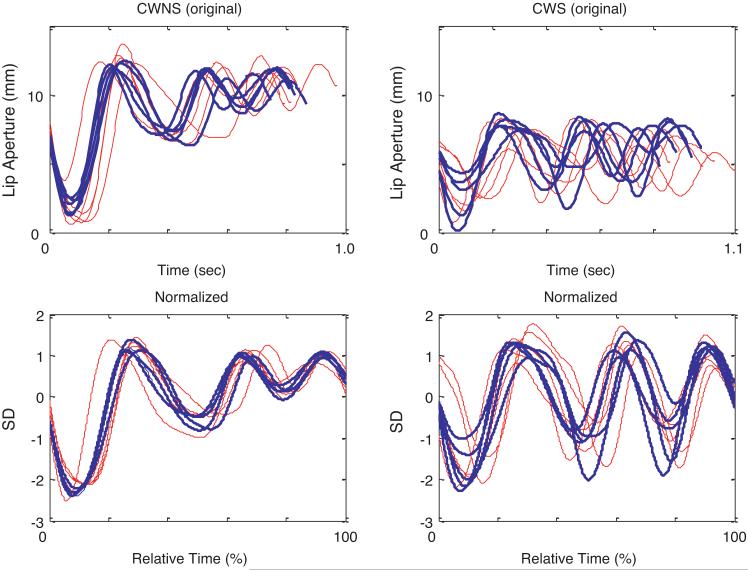
Fig. 1.
Sample kinematic data for “mabteebeebee” from a typically developing child, left column, and a child who stutters, right column. The top panel for each child shows the lip aperture trajectories for the sets of 5 early productions (thinner, red traces) and 5 later productions (thicker, blue traces). The top graphs show distance between the upper lip and lower lip (lip aperture signal) in mm as a function of real time. The lower plots show the same trajectories after time and amplitude normalization. From the two top plots, it is apparent that the two children are producing very different movement patterns. The CWNS child produced larger oral openings for the first syllable, whereas the CWS produced opening movements of about the same size for all four syllables. Also from the original data plots, we see that the red (early 5) trajectories tend to be of longer duration compared to the thicker, blue trajectories for both children, indicating the overall practice effect we observed: the later productions were produced faster. Also the blue trajectories tend to converge together in a tighter pattern compared to the early set. This suggests that the later productions were more consistently coordinated, and this should be reflected in lower lip aperture variability indices for the later compared to the early trials. This was the case. For the CWNS child the early trials LA Var was 18.7 and for the later trials 8.5; while for the stuttering child the indices were early 31.2 and later trials 21.4. (For interpretation of the references to color in this figure legend, the reader is referred to the web version of the article.)

