Figure 1.
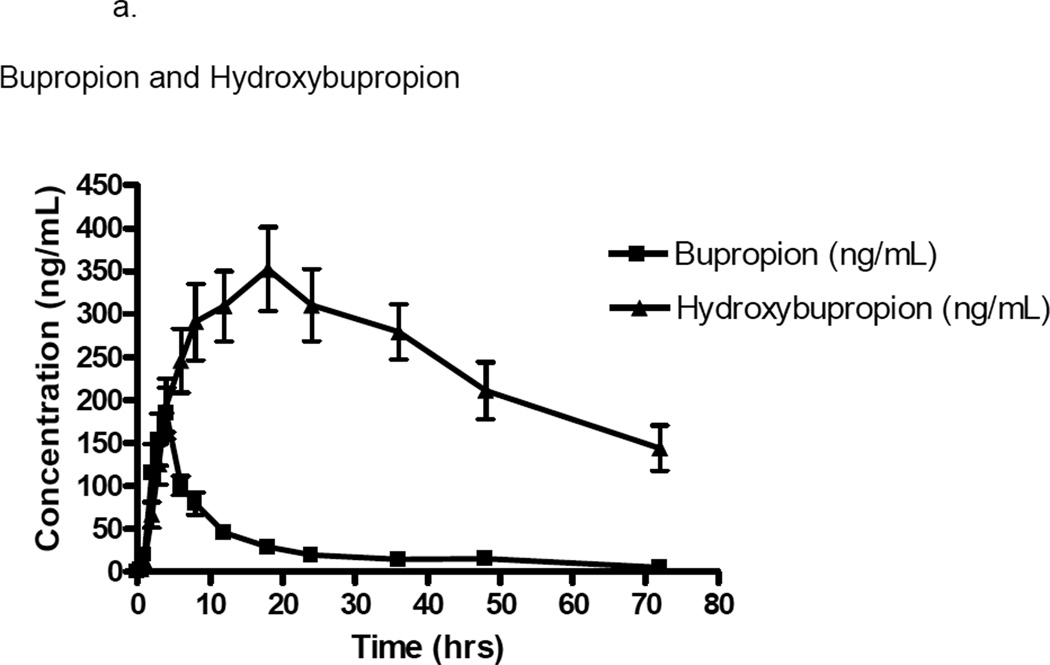
a. Plasma concentration (ng/mL) versus time (hours) curve of bupropion and hydroxybuproprion in ten patients with glomerulonephritis. Error bars represent mean ± standard deviation.
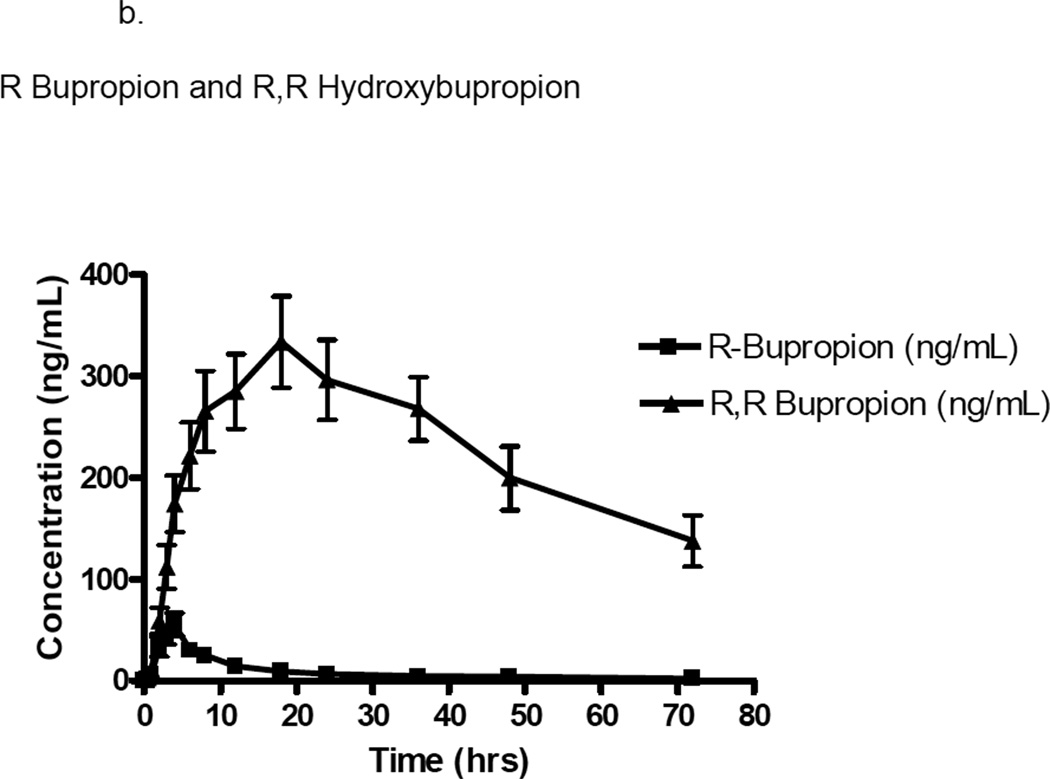
b. Plasma concentration (ng/mL) versus time (hours) curve of R bupropion and R,R hydroxybupropion in ten patients with glomerulonephritis. Error bars represent mean ± standard deviation.
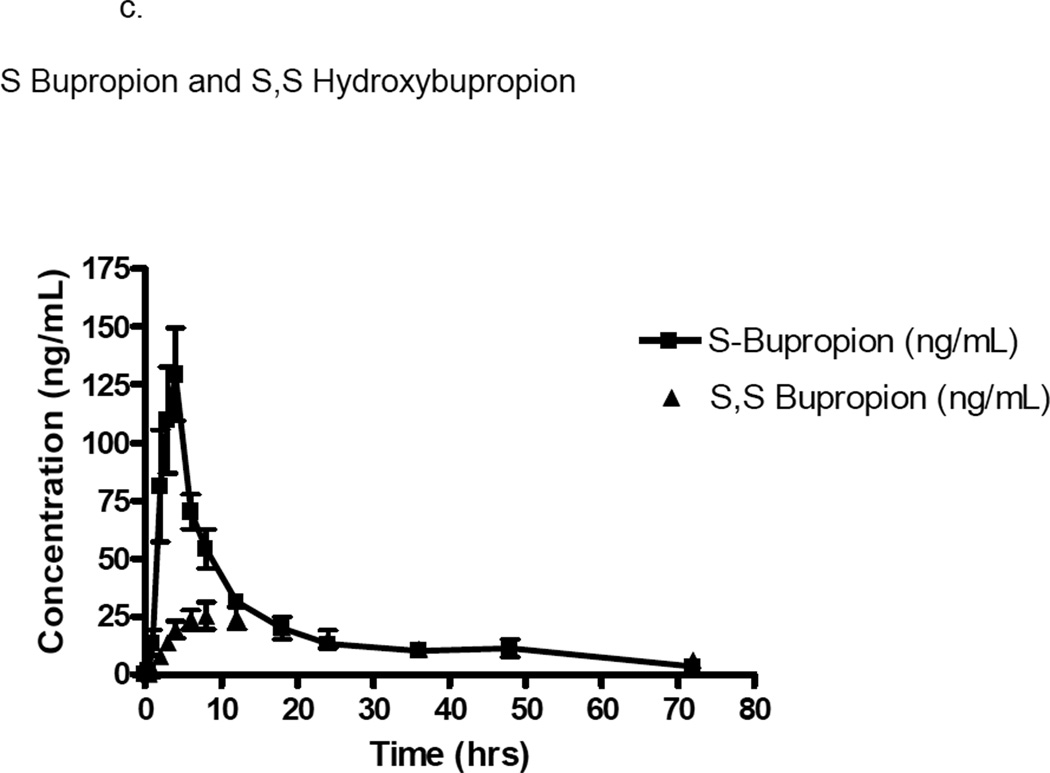
c. Plasma concentration (ng/mL) versus time (hours) curve of S bupropion and S,S hydroxybupropion in ten patients with glomerulonephritis. Error bars represent mean ± standard deviation.


