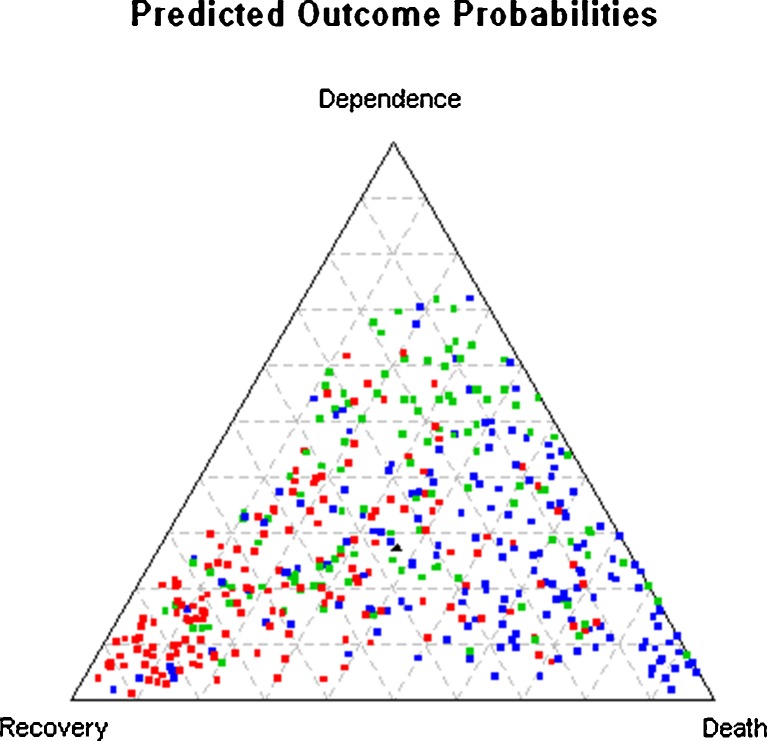
Figure 2.
Predicted probabilities of recovery, dependence and death in all subjects combined. Figure 2 is created by stacking Figure 1a–c on top of each other, with colors used to reflect the actual outcomes for each subject (red = recovery, green = dependence, blue = death). The black triangle in the center reflects the marginal predicted probabilities for the three outcomes (36 % recovery, 27 % dependence, 37 % death).

